Net Collection Rate Benchmark: 95% Minimum, 85% to 100% Measured
By MedicalBillingSelect · Updated October 2026
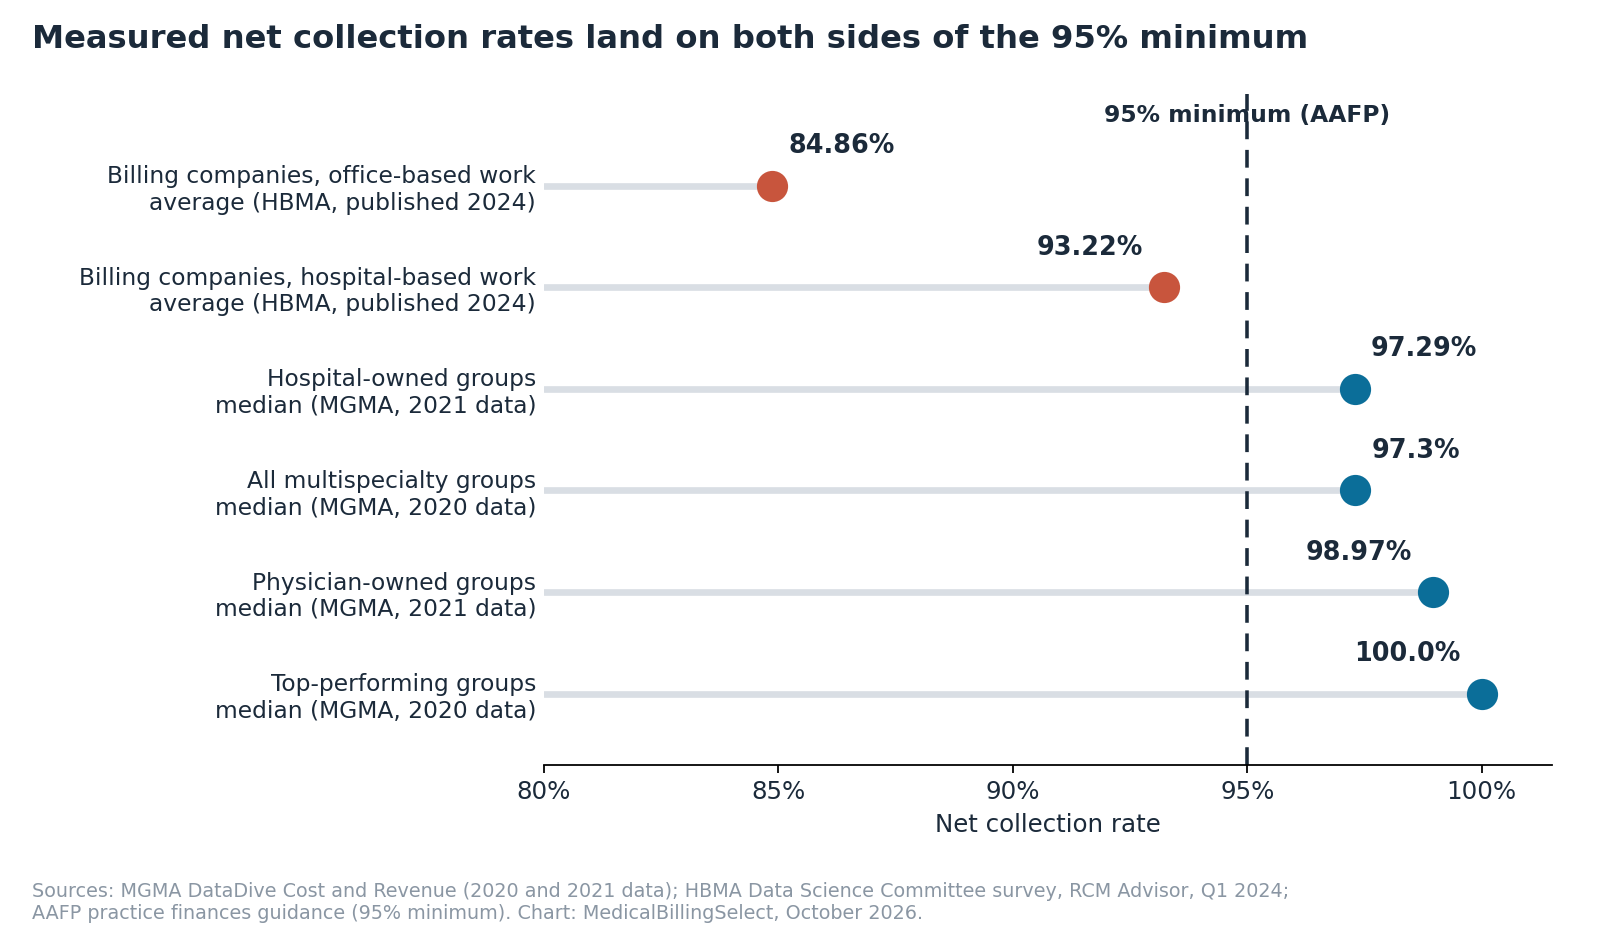
The net collection rate benchmark is 95% or higher, per the American Academy of Family Physicians. Measured results land on both sides of 95%: a 97.3% median at multispecialty groups (MGMA, 2020 data) and an 84.86% average reported by billing companies for office-based work (HBMA, published 2024), according to MedicalBillingSelect's October 2026 review. Gross collection rate has no single benchmark.
Key net collection rate statistics
- 95% is the minimum net collection rate the American Academy of Family Physicians (AAFP) recommends. It says the average runs 95% to 99% and the best practices reach 99% or more. (AAFP practice finances guidance, undated, checked October 2026.)
- 97.3% was the median net collection rate at multispecialty medical groups in MGMA's survey. (MGMA DataDive Cost and Revenue, 2020 data.)
- 100.0% was the median at the groups MGMA rates as top performers on billing operations. (MGMA DataDive Cost and Revenue, 2020 data.)
- 84.86% was the average net collection ratio billing companies reported for office-based work, and 93.22% for hospital-based work. (HBMA member survey, published in the first quarter of 2024; 37 responses to the question.)
- 14 of 16 measured net collection figures we found, published from 1999 to 2024, sit at or above 95%. The two below it both come from the billing-company survey. (MedicalBillingSelect review, October 2026.)
- About $7,400 a year per physician is what one point of net collection rate was worth at the median multispecialty group. (MedicalBillingSelect math on MGMA 2020 medians: 1% of $736,222.)
- About $16,900 a year per physician separates a practice at exactly 95% from the median group at 97.3%. (MedicalBillingSelect math on MGMA 2020 medians.)
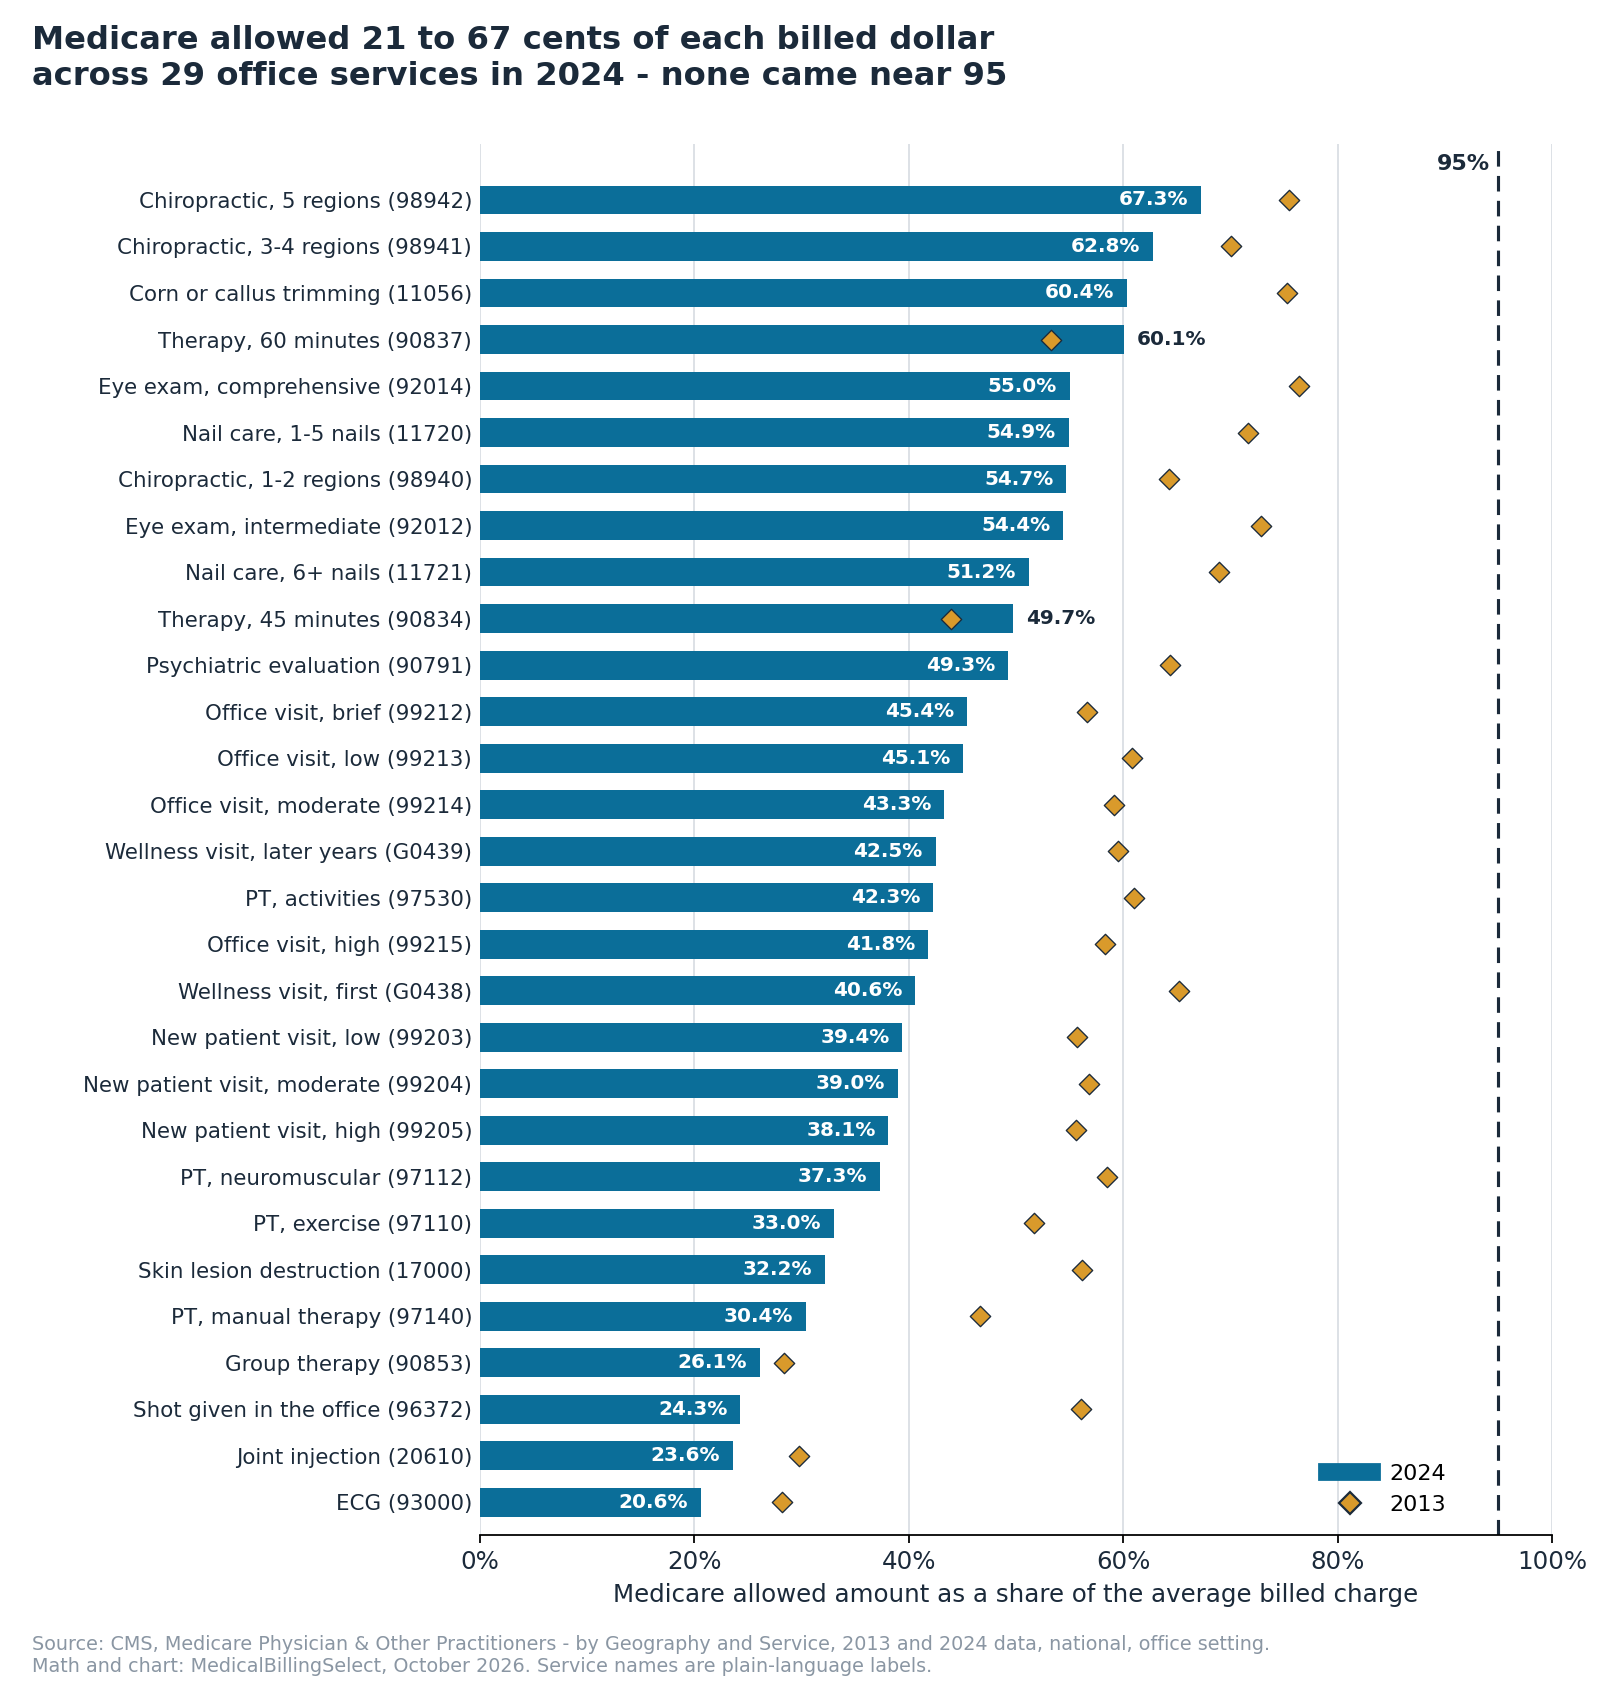
- 42 cents of every billed dollar is what Medicare allowed across 29 common office services in 2024. In 2013 it was 58 cents. (MedicalBillingSelect analysis of CMS data.)
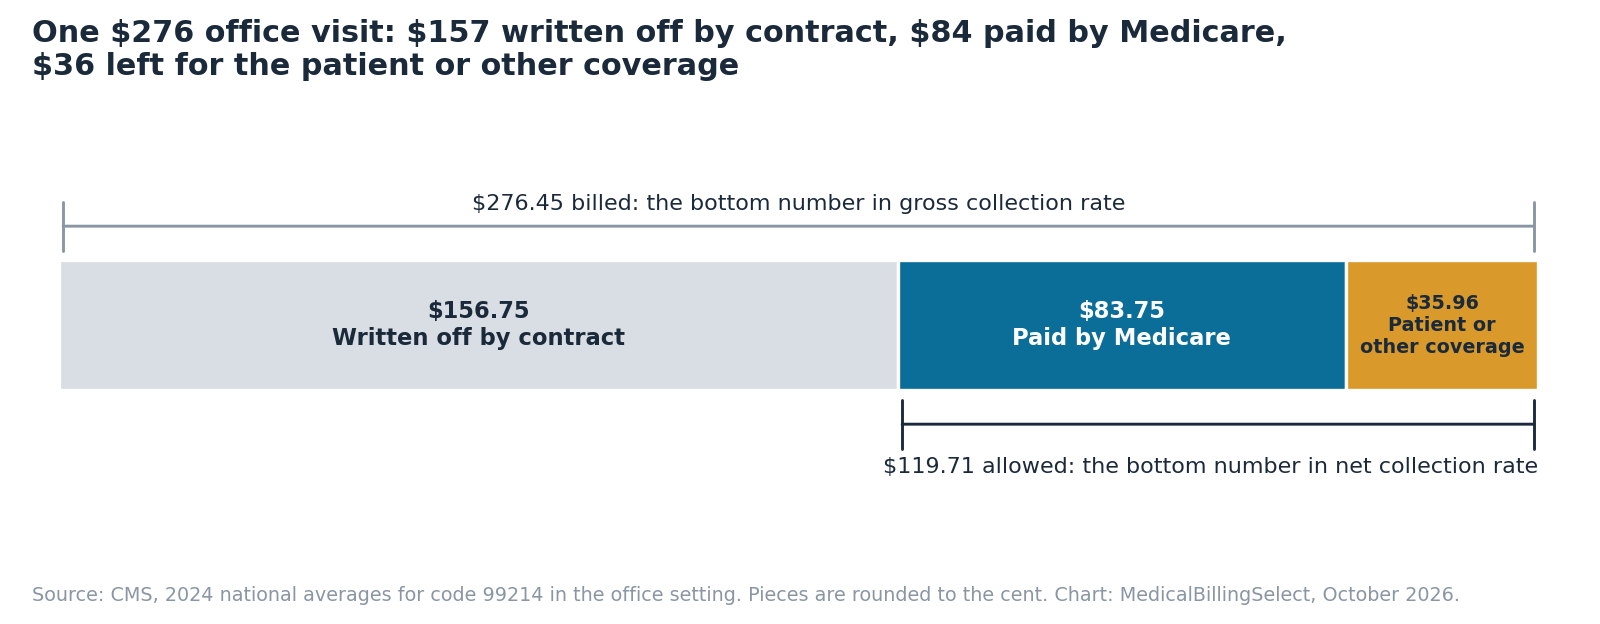
- $276.45 billed, $119.71 allowed: the national averages for the most common office visit, code 99214, in 2024. That is 43.3%. (MedicalBillingSelect analysis of CMS data.)
- 0 of 29 office services had an allowed amount near 95% of the billed charge in 2024. The share ran from 20.6% for an ECG to 67.3% for a chiropractic adjustment. (MedicalBillingSelect analysis of CMS data.)
- 53.57% was the average gross collection ratio billing companies reported for office-based work, and 64.67% for hospital-based work. (HBMA member survey, published in the first quarter of 2024.)
- 30% of the allowed amount on a 99214 office visit had to come from someone other than Medicare in 2024: the patient or other coverage. (MedicalBillingSelect analysis of CMS data.)
- $18,765 vs. $5,688: median bad debt per physician at all multispecialty groups and at top performers. (MGMA DataDive Cost and Revenue, 2020 data.)
- 19% of in-network claims were denied by HealthCare.gov insurers in 2024. (KFF analysis of federal data.)
On this page: Calculator · What is a good rate? · Formula · Net vs. gross · Gross benchmark · What a point is worth · Where 95% comes from · Why it is harder now · Method · Cite · Data · FAQ · Sources
Net collection rate calculator
Pull three numbers from your billing report for the same 12 months: what you billed, what your payer contracts took off, and what you were paid. The calculator turns them into your net collection rate, your gross collection rate, and the dollars behind each point.
It runs in your browser. It does not send or save what you type.
Calculator
Enter totals for one period. Use the same dates and scope for charges, adjustments, payments and refunds.
All math runs in the browser. Entered figures are not sent, saved, logged, or included in analytics or session recordings. No sign-up and no email field. Totals only; no patient details. The calculator stores no personal data.
Here is one worked through. Say you billed $1,000,000 last year. Your contracts took off $550,000. That leaves $450,000 you were allowed to collect. You were paid $432,000 and gave back $4,500 in refunds, so you kept $427,500.
- Net collection rate: $427,500 ÷ $450,000 = 95.0%
- Gross collection rate: $427,500 ÷ $1,000,000 = 42.75%
- One point: 1% of $450,000 = $4,500 a year
Same practice, same money, two very different-looking numbers. The rest of this page is about which one to trust and what to hold it up against.
What is a good net collection rate?
A good net collection rate is 95% or higher. That is the minimum the American Academy of Family Physicians recommends. Published survey results run from an 84.86% average for billing companies' office-based work (HBMA, published 2024) to a 100.0% median at MGMA's top-performing medical groups (2020 data).
Two kinds of numbers get called "benchmarks," and it pays to keep them apart. One kind is advice: someone says where you should be. The other kind is a measurement: someone counted where practices really are. The table shows both.
| Figure | Kind of number | Who it covers | Data period | Source |
|---|---|---|---|---|
| 95% minimum | Guidance | Medical practices | Not dated | AAFP |
| 95% to 99% average; 99% or more for the best | Guidance | Medical practices | Not dated | AAFP |
| 84.86% average | Survey result | Office-based work at billing companies | Not stated; published Q1 2024 | HBMA |
| 93.22% average | Survey result | Hospital-based work at billing companies | Not stated; published Q1 2024 | HBMA |
| 97.29% median | Survey result | Hospital-owned multispecialty groups | 2021 | MGMA |
| 97.3% median | Survey result | All multispecialty groups | 2020 | MGMA |
| 98.97% median | Survey result | Physician-owned multispecialty groups | 2021 | MGMA |
| 100.0% median | Survey result | Top-performing multispecialty groups | 2020 | MGMA |
A median is the middle value. Half the groups are above it and half are below. An average adds everyone up and divides, so a few very low numbers can pull it down.
Sources: MGMA DataDive Cost and Revenue (2020 and 2021 data); HBMA Data Science Committee survey, RCM Advisor, Q1 2024; AAFP practice finances guidance (95% minimum). Chart: MedicalBillingSelect, October 2026.
Why do the two surveys land so far apart?
The honest answer: the surveys don't say. But four differences are in plain sight.
- Different people answered. MGMA surveys medical groups. HBMA, the Healthcare Business Management Association, is a trade group for billing and revenue cycle companies, and it surveyed its own members.
- One is a median and one is an average. They are not the same kind of number.
- The formulas may not match. MGMA takes more than contract write-offs out of the bottom number. Its glossary also removes charity care, courtesy discounts and employee discounts. Take more out of the bottom and the rate goes up. HBMA's summary does not print its formula.
- HBMA's count is small. It lists 37 responses to this question, split between "office based" and "hospital based" work. It does not say how many fall in each, or which months the numbers cover.
We can't tell you how much each one matters. What we can say is that a "net collection rate" from one source is not automatically the same thing as a "net collection rate" from another.
That matters most when someone is selling you on a number. If a billing company quotes its collection rate, ask what it divides by. Our methodology explains how we treat collection-rate claims from billing companies.
How did medical groups do from 2017 to 2021?
Physician-owned groups had a median net collection rate between 98.43% and 99.24% in every year from 2017 to 2021. Hospital-owned groups ran between 96.12% and 97.29%. Physician-owned groups were ahead all five years, by 1.17 to 2.76 points.
| Data year | Physician-owned | Hospital-owned | Gap in points (our math) |
|---|---|---|---|
| 2017 | 98.43% | 96.73% | 1.70 |
| 2018 | 99.24% | 96.48% | 2.76 |
| 2019 | 98.45% | 97.28% | 1.17 |
| 2020 | 98.76% | 96.12% | 2.64 |
| 2021 | 98.97% | 97.29% | 1.68 |
These are the newest medians MGMA has put in the open that we could find. Later years sit inside its paid data tool.
Is the benchmark different for insurance and patient balances?
Two MGMA articles from February 2025 use different reference points for the two kinds of money: 98.5% for insurance balances and 92% for patient balances. Each appears in a formula for sizing missed revenue. Neither is labeled a survey result.
The takeaway is simple. Insurers pay more of what they owe than patients do, so a blended rate hides two different stories. If your billing system can split the two, look at them apart.
Are there targets for surgery centers and labs?
Yes, but they are one company's view, not survey results. A director at Regent RCM told Becker's ASC Review in 2019 that surgery centers should aim above 97%. XiFin, a billing technology company that works with labs, wrote in 2019 that 90% is a national target for labs, and that 80% to 85% may be acceptable in rural areas with many Medicaid or uninsured patients.
Is there a net collection rate benchmark by specialty or by state?
Not in the open, as far as we could find. MGMA keeps its finer cuts inside its paid data tool, and we found no public source that reports this number by state. You will see specialty and practice-size bands on other sites. We could not trace them to a survey, so we left them out.
How do you calculate net collection rate?
Net collection rate is payments minus refunds, divided by charges minus contractual adjustments, times 100. A practice that keeps $427,500 of the $450,000 its contracts allowed has a net collection rate of 95%.
In plain words: of the money you were allowed to collect, how much did you collect?
What is the net collection rate formula?
Net collection rate = (payments − refunds) ÷ (charges − contractual adjustments) × 100
A contractual adjustment is the part of your price that a payer's contract says you must write off. Bill $200, have a contract that allows $90, and the adjustment is $110.
The big names write the same idea in slightly different words.
| Who | What they call it | Top number | Bottom number |
|---|---|---|---|
| AAFP | Adjusted collection rate | Payments, net of credits | Charges, net of approved contractual agreements |
| MGMA | Adjusted fee-for-service collection percentage, also called net collection percentage | Net fee-for-service revenue | Adjusted fee-for-service charges |
| This page | Net collection rate | Payments minus refunds | Charges minus contractual adjustments |
Which write-offs come out of the bottom number?
Only contractual adjustments. Write-offs for a late-filed claim, a missed prior authorization or a patient who never paid stay in the bottom number, because that was money you were allowed to collect and didn't.
This is where a rate can be made to look better than it is. AAFP lists sorting write-offs into the wrong bucket as a common problem. Here is what it does to the number.
| Counted right | Counted wrong | |
|---|---|---|
| Money you were allowed to collect | $1,000,000 | $1,000,000 |
| Unpaid balances wrongly filed as "contractual" | $0 | $100,000 |
| Bottom number used | $1,000,000 | $900,000 |
| Payments | $900,000 | $900,000 |
| Net collection rate | 90% | 100% |
Not one extra dollar came in. The rate jumped ten points anyway.
One wrinkle: MGMA's own definition is wider than "contractual." Its glossary also takes out charity care, courtesy and employee discounts, and refunds for overpayments. So before you hold your number up against an MGMA median, check that your report treats those the same way.
How should refunds be counted?
Once. Subtract refunds and reversals from payments, and do it one time. If the payments total on your report is already net of refunds, don't subtract them again.
Which dates should you use?
AAFP says to use 12 months. Beyond that, the cleanest method is to match payments to the visits that earned them, by date of service, instead of lumping together whatever was posted in a month. A 2012 AAPC article offers a fallback: if your system can't match payments to charges, use data that is about six months old, so most claims have had time to settle.
Billing people call the first method a "matched" net collection rate. Recent months will always look low on a matched report, because some of that money hasn't arrived yet.
How do you combine months or payers?
Add the dollars first, then divide. Don't average the percentages.
| Payments | Allowed to collect | Rate | |
|---|---|---|---|
| Payer A | $99,000 | $100,000 | 99% |
| Payer B | $810,000 | $900,000 | 90% |
| Dollars added first | $909,000 | $1,000,000 | 90.9% |
| Average of the two percentages | 94.5% (wrong) |
The small payer and the big payer get equal say when you average percentages. They shouldn't.
Can net collection rate be over 100%?
Yes, for a while. Payments for older visits can land in a month with few new charges. Physicians Practice made the same point in 2005: the ratio is measured after the fact, and payers don't all pay on the same schedule. Over a full year matched by date of service, a rate that stays above 100% means something is off in the data.
Does the billing company's fee come out of net collection rate?
No. Net collection rate measures what was collected, before anyone's fee. A billing company's fee is a separate cost, usually a percent of collections, so read the two together. Our homepage shows how a monthly minimum changes a percentage billing fee.
What is the difference between net and gross collection rate?
Both rates use the same payments. Gross collection rate divides them by everything you billed at full price. Net collection rate divides them by what payers agreed you could collect. In the worked example above, the same practice is at 42.75% gross and 95% net.
| Net collection rate | Gross collection rate | |
|---|---|---|
| Top number | Payments minus refunds | Payments minus refunds |
| Bottom number | Charges minus contractual adjustments | All charges at full price |
| The question it answers | Of what I was allowed to collect, how much did I collect? | Of my list prices, how much turned into cash? |
| What moves it | Denials nobody fixed, unpaid patient balances, write-offs | All of that, plus your price list and your contracts |
| Published minimum | 95% (AAFP) | None found |
| Fair to compare with other practices? | Yes, if both count the same way | No |
A real example makes it stick. In 2024, the average bill for the most common office visit in Medicare (code 99214) was $276.45. Medicare's allowed amount was $119.71. So $156.75 came off by contract before anyone tried to collect a cent. Collect the full $119.71 and you are at 100% net. You are also at 43% gross.
Source: CMS, 2024 national averages for code 99214 in the office setting. Pieces are rounded to the cent. Chart: MedicalBillingSelect, October 2026.
Is there a gross collection rate benchmark?
No single one. Gross collection rate depends on how high a practice sets its prices, so it can't be compared fairly from one practice to the next. Across 29 common office services, Medicare allowed 42 cents of every billed dollar in 2024, according to MedicalBillingSelect's analysis of CMS data. A practice that collected every allowed dollar on those claims would still show a gross rate near 42%.
Here is what we did. We pulled Medicare's national averages for 29 everyday office services, from a brief office visit to a therapy session to a chiropractic adjustment. For each one we divided the amount Medicare allows by the amount practices bill. That share is the ceiling. It is the highest gross collection rate a practice could reach on that service for Medicare patients, even with perfect collections.
| Code | Service | Type | Avg billed, 2024 | Medicare allowed, 2024 | Allowed share, 2024 | Allowed share, 2013 | Change in points |
|---|---|---|---|---|---|---|---|
| 99212 | Office visit, established patient, brief | Office visits and wellness | $118.03 | $53.59 | 45.4% | 56.6% | -11.2 |
| 99213 | Office visit, established patient, low complexity | Office visits and wellness | $189.25 | $85.37 | 45.1% | 60.8% | -15.7 |
| 99214 | Office visit, established patient, moderate complexity | Office visits and wellness | $276.45 | $119.71 | 43.3% | 59.1% | -15.8 |
| 99215 | Office visit, established patient, high complexity | Office visits and wellness | $406.36 | $169.67 | 41.8% | 58.3% | -16.6 |
| 99203 | Office visit, new patient, low complexity | Office visits and wellness | $267.25 | $105.33 | 39.4% | 55.7% | -16.3 |
| 99204 | Office visit, new patient, moderate complexity | Office visits and wellness | $410.82 | $160.28 | 39.0% | 56.8% | -17.8 |
| 99205 | Office visit, new patient, high complexity | Office visits and wellness | $560.92 | $213.67 | 38.1% | 55.6% | -17.5 |
| G0438 | Annual wellness visit, first | Office visits and wellness | $369.83 | $150.17 | 40.6% | 65.2% | -24.6 |
| G0439 | Annual wellness visit, later years | Office visits and wellness | $277.82 | $118.08 | 42.5% | 59.5% | -17.0 |
| 96372 | Injection given in the office (shot administration) | Office visits and wellness | $55.33 | $13.42 | 24.3% | 56.1% | -31.8 |
| 90791 | Psychiatric diagnostic evaluation | Mental health | $293.32 | $144.74 | 49.3% | 64.4% | -15.1 |
| 90834 | Psychotherapy, 45 minutes | Mental health | $175.89 | $87.48 | 49.7% | 43.9% | +5.8 |
| 90837 | Psychotherapy, 60 minutes | Mental health | $207.77 | $124.97 | 60.1% | 53.3% | +6.8 |
| 90853 | Group psychotherapy | Mental health | $87.50 | $22.81 | 26.1% | 28.4% | -2.3 |
| 97110 | Therapeutic exercise, per 15 minutes | Physical therapy | $69.14 | $22.79 | 33.0% | 51.7% | -18.7 |
| 97112 | Neuromuscular re-education, per 15 minutes | Physical therapy | $72.64 | $27.07 | 37.3% | 58.5% | -21.3 |
| 97140 | Manual therapy, per 15 minutes | Physical therapy | $67.80 | $20.62 | 30.4% | 46.6% | -16.2 |
| 97530 | Therapeutic activities, per 15 minutes | Physical therapy | $74.55 | $31.54 | 42.3% | 61.0% | -18.7 |
| 98940 | Chiropractic adjustment, 1-2 spinal regions | Chiropractic | $48.93 | $26.75 | 54.7% | 64.3% | -9.7 |
| 98941 | Chiropractic adjustment, 3-4 spinal regions | Chiropractic | $60.72 | $38.13 | 62.8% | 70.1% | -7.4 |
| 98942 | Chiropractic adjustment, 5 spinal regions | Chiropractic | $74.10 | $49.84 | 67.3% | 75.5% | -8.2 |
| 11056 | Trimming of 2-4 corns or calluses | Podiatry | $134.63 | $81.30 | 60.4% | 75.3% | -14.9 |
| 11720 | Nail debridement, 1-5 nails | Podiatry | $59.42 | $32.60 | 54.9% | 71.6% | -16.8 |
| 11721 | Nail debridement, 6 or more nails | Podiatry | $85.64 | $43.86 | 51.2% | 68.9% | -17.7 |
| 92012 | Eye exam, established patient, intermediate | Eye care | $167.14 | $90.86 | 54.4% | 72.9% | -18.6 |
| 92014 | Eye exam, established patient, comprehensive | Eye care | $226.69 | $124.79 | 55.0% | 76.4% | -21.3 |
| 17000 | Destruction of one precancerous skin lesion | Skin procedure | $154.95 | $49.89 | 32.2% | 56.2% | -24.0 |
| 20610 | Injection or drainage of a large joint | Joint injection | $281.20 | $66.41 | 23.6% | 29.8% | -6.2 |
| 93000 | Electrocardiogram (ECG) with interpretation | Heart test | $69.03 | $14.20 | 20.6% | 28.2% | -7.6 |
Source: CMS, 2013 and 2024 national averages, non-facility office setting. Shares and chart: MedicalBillingSelect, October 2026.
Why can't 95% be a gross collection rate benchmark?
Because of the math in that table. A 95% gross rate would mean you bill only about 5% more than payers allow. None of the 29 services came close in 2024. The highest was 67.3%, and only 9 of the 29 were above 50%.
Several widely read guides list 90% to 95% as a gross collection benchmark. That figure belongs to net. If you see it attached to gross, the two got swapped.
What do measured gross collection rates look like?
They sit far below 95%, and they move with the price list. The measured figures we found range from 44.6% to 75.88%.
| Figure | Who it covers | Data period | Source |
|---|---|---|---|
| 53.57% average | Office-based work at billing companies | Not stated; published Q1 2024 | HBMA |
| 64.67% average | Hospital-based work at billing companies | Not stated; published Q1 2024 | HBMA |
| 44.6% median | Cardiology practices | 2003 | MGMA data, reported by Physicians Practice |
| 75.88% average | Family practices | 1997 | MGMA 1998 Cost Survey, reported by Family Practice Management |
A 2017 study in JAMA points the same way. Using 2014 Medicare data for 429,273 physicians, it found that doctors' charges were a median 2.5 times what Medicare allowed. Flip that around and Medicare's allowed amount was 40% of the typical bill (1 ÷ 2.5, our math).
Our 29 services break out like this.
| Services we checked | Codes | Allowed share, 2024 | Allowed share, 2013 |
|---|---|---|---|
| All 29 services | 29 | 42.2% | 58.3% |
| Office visits and wellness | 10 | 42.8% | 59.1% |
| Mental health | 4 | 56.2% | 48.4% |
| Physical therapy | 4 | 36.0% | 51.9% |
| Chiropractic | 3 | 61.7% | 69.1% |
| Podiatry | 3 | 54.5% | 70.6% |
Why do old gross collection benchmarks go stale?
Because prices climbed and allowed amounts barely moved. For the same 29 services, Medicare allowed 58.3% of billed charges in 2013 and 42.2% in 2024. That is a 16-point drop in 11 years.
The most common office visit shows it cleanly. From 2013 to 2024 the average bill for a 99214 went from $174.04 to $276.45, up 58.8%. Medicare's allowed amount went from $102.86 to $119.71, up 16.4%. So the allowed share slid from 59.1% to 43.3%.
The share fell for 27 of the 29 services. The two that rose are 45-minute and 60-minute therapy sessions, where Medicare's allowed amounts grew faster than bills did.
Think of a price tag that climbs every year while the amount the buyer will actually pay stays about the same. The gap grows. Nobody got worse at collecting.
What gross rate goes with a given net rate?
Multiply your net rate by the share of your billed charges that your contracts allow. If contracts allow 40% of what you bill and you collect 95% of that, your gross rate is 38%.
| Contracts allow this share of billed charges | Net 90% | Net 95% | Net 97.3% | Net 100% |
|---|---|---|---|---|
| 20% | 18.0% | 19.0% | 19.5% | 20.0% |
| 30% | 27.0% | 28.5% | 29.2% | 30.0% |
| 40% | 36.0% | 38.0% | 38.9% | 40.0% |
| 50% | 45.0% | 47.5% | 48.7% | 50.0% |
| 60% | 54.0% | 57.0% | 58.4% | 60.0% |
| 70% | 63.0% | 66.5% | 68.1% | 70.0% |
What is gross collection rate still good for?
Watching your own practice over time. If your prices and contracts haven't changed and your gross rate suddenly drops, something in billing changed. That is worth a look. It just isn't a number to hold up against the practice down the street.
One caution on the Medicare table: it is Medicare only. Your all-payer gross rate depends on your own mix of contracts, so it will not match these figures.
How much is one point of net collection rate worth?
One point of net collection rate is 1% of the money you were allowed to collect: $10,000 for every $1 million. At the median multispecialty group that came to about $7,400 per physician per year, according to MedicalBillingSelect's math on MGMA's 2020 medians.
| Group (MGMA medians) | Collectible charges per physician | One point | Median net rate | Points above 95% | Dollars above the 95% line |
|---|---|---|---|---|---|
| All multispecialty groups, 2020 data | $736,222 | $7,362 | 97.3% | 2.30 | $16,933 |
| Top-performing groups, 2020 data | $889,839 | $8,898 | 100.0% | 5.00 | $44,492 |
| Physician-owned groups, 2021 data | $1,416,180 | $14,162 | 98.97% | 3.97 | $56,222 |
| Hospital-owned groups, 2021 data | $553,954 | $5,540 | 97.29% | 2.29 | $12,686 |
Read the first row like this. The median group had $736,222 in collectible charges per physician. One percent of that is $7,362. The median group collected 97.3%, which is 2.3 points above 95%. So a practice sitting right at 95% brings in about $16,900 less per physician each year than the median group (2.3 × $7,362).
Each of those sums pairs two medians, so treat them as a fair illustration, not a measured loss.
Bad debt, the money a practice was owed and never got, tells the same story from the other side. Median bad debt was $18,765 per physician at all multispecialty groups in 2020 and $5,688 at top performers. That is about 70% less.
A gap to a target is not a pile of money waiting to be picked up. Some of it is patients who can't pay and claims that can't be fixed.
Where does the 95% benchmark come from?
The 95% benchmark is guidance, not a survey result. The oldest dated copy we found is a December 2012 AAPC article that calls a rate below 95% poor, 95% to 99% average, and above 99% a top performer. The AAFP's current guidance uses nearly the same three steps. Neither names a study behind them.
| When | Where | What it says | Kind of number |
|---|---|---|---|
| October 1999 | Family Practice Management, reporting MGMA's 1998 Cost Survey | Family practices averaged 98.65% net and 75.88% gross in 1997 | Survey result |
| October 2005 | Physicians Practice, reporting MGMA data | Cardiology practices had a median of 96.61% net and 44.6% gross in 2003 | Survey result |
| December 2012 | AAPC article | Below 95% is poor; 95% to 99% is average; above 99% is a top performer | Guidance, no source named |
| Not dated (checked October 2026) | AAFP practice finances page | 95% minimum; 95% to 99% average; 99% or more for the best | Guidance, no source named |
| December 2021 and August 2023 | MGMA Data Mine columns | Medians from 96.12% to 99.24%; 100.0% for top performers | Survey results |
| April 2023, updated September 2024 | Article on HFMA's site, sponsored by Conifer Health Solutions | 95% minimum; 97% to 99% "optimal"; credits AAFP for the minimum | Sponsored guidance |
| First quarter 2024 | HBMA member survey | Averages of 93.22% (hospital-based) and 84.86% (office-based) | Survey result |
You will often see 95% credited to MGMA. We could not find an MGMA page that sets it. What MGMA publishes is a formula, medians, and a rule. To count as one of its top performers on billing operations, a group has to beat the median on net collection rate and two other measures. Its bar moves with the data. It is not a fixed 95%.
So 95% is best read as a floor someone drew, and a sensible one. Of the 16 measured net figures we found, 14 are at or above it.
Why is a 95% net collection rate harder to hold now?
More of each allowed dollar now has to come from patients, and many claims are denied on the first try. On the most common Medicare office visit in 2024, 30% of the allowed amount had to come from the patient or other coverage. HealthCare.gov insurers denied 19% of in-network claims that year.
Start with who pays. For a 99214 visit in 2024, Medicare allowed $119.71 and paid $83.75 of it. The other $35.96 was the patient's share or a second insurer's. Across all 29 services we checked, Medicare itself paid 72.5% of the allowed amount. The remaining 27.5% had to be collected from someone else.
Patient balances are the hardest dollars to bring in. Kodiak Solutions, which tracks claims for the hospitals, health systems and medical practices that use its software, reported that providers collected 34.46% of what insured patients owed in 2024, down from 37.58% in 2023. It also put first-pass denials at 11.81% of claims in 2024, up from 11.53%.
Denials are the other drag. KFF found that insurers selling plans on HealthCare.gov denied 19% of in-network claims in 2024. A denied claim can still be paid after an appeal or a fix. But every one that nobody works shows up as a lower net collection rate.
If a low rate has you weighing outside billing help, start with what billing companies publish about their fees, minimums and contract terms, and ask each one how it counts its collection rate.
How we built this
Everything here was checked on October 5, 2026.
- Guidance. We read the AAFP practice finances page, a 2012 AAPC article, and an article on HFMA's site that Conifer Health Solutions sponsored. We copied each figure with its label and date.
- MGMA medians. These come from three tables in two of MGMA's Data Mine columns (December 14, 2021 and August 11, 2023). MGMA publishes the tables as images. We read each one twice and checked the readings against numbers MGMA states in the article text.
- HBMA averages. These come from the Data Science Committee survey article in HBMA's RCM Advisor, first quarter 2024.
- Medicare table. We pulled national, office-setting rows for 29 codes from CMS's public data service for 2013 and 2024, then divided the average allowed amount by the average billed charge. For the roll-ups we weighted each code by how many times it was billed. We chose codes that are common, are done in an office, and cover primary care, mental health, physical therapy, chiropractic, podiatry and eye care. We left out surgery and hospital-based codes, where the same code can also be billed by a facility. That choice was ours.
- Dollar figures. One point = 1% of MGMA's median collectible charges per physician. The sums are in the tables and in the data files.
- Rows checked against the primary source: every Medicare row, every MGMA median, the HBMA averages, and the AAFP, AAPC and HFMA-hosted figures.
To redo the Medicare math, query CMS's data service for the "by Geography and Service" dataset, national level, place of service "O," for the codes in the table. The data file lists every code and value we used.
What this data does and does not show
- MGMA's medians come from medical groups that chose to answer its survey. The ones shown here are for multispecialty groups with primary and specialty care. A solo or small single-specialty practice may look different. The newest year in the open is 2021.
- HBMA's averages come from a small member survey. The article gives 37 responses to the question, no formula, no date range, and no count for each kind of work.
- The two surveys are not a matched pair. We show them side by side. We do not subtract one from the other.
- Dollar figures pair two medians. They illustrate scale. They are not measured losses.
- The Medicare table is Medicare only, national averages, for 29 services we picked. It does not show any one practice's gross rate.
- By state: no public source reports net collection rate by state, so there is no state table here.
- Nothing on this page predicts what a billing company will collect for you. It is general information, not accounting, legal or coding advice.
How to cite this page
- Publication: MedicalBillingSelect Research
- Title: Net Collection Rate Benchmark: 95% Minimum, 85% to 100% Measured
- URL: https://medicalbillingselect.com/research/net-collection-rate/
- Updated: October 2026
Ready to copy:
MedicalBillingSelect Research. "Net Collection Rate Benchmark: 95% Minimum, 85% to 100% Measured." Updated October 2026. https://medicalbillingselect.com/research/net-collection-rate/
You may reuse MedicalBillingSelect's own calculations, tables and charts with credit to MedicalBillingSelect. Figures from AAFP, MGMA, HBMA, CMS, KFF and others remain theirs. Keep their names with their numbers and follow their terms.
Download the data
Four CSV files, free, no sign-up. Every row has its source and the date we checked it. Columns that start with OURS_ are our math. Everything else is the source's number.
- Net collection rate benchmarks and measured results
- Value of one point of net collection rate (MGMA medians)
- Medicare billed vs. allowed for 29 office services, 2013 and 2024
- Net-to-gross collection rate lookup
Frequently asked questions
What is a good net collection rate?
95% or higher. That is the minimum the American Academy of Family Physicians recommends. In MGMA's survey the median multispecialty group collected 97.3% (2020 data), and top-performing groups collected 100.0%.
How do you calculate net collection rate?
Subtract refunds from payments. Subtract contractual adjustments from charges. Divide the first by the second and multiply by 100. For example, $427,500 ÷ $450,000 = 95%.
What is a good collection percentage for a medical practice?
It depends which percentage. For net collection rate, 95% or higher. For gross collection rate there is no single benchmark, because it changes with your prices: Medicare allowed 42% of billed charges across 29 common office services in 2024.
What is a good gross collection rate?
There is no single good number. Billing companies in HBMA's survey averaged 53.57% for office-based work and 64.67% for hospital-based work. Use your gross rate to watch your own trend, not to compare with other practices.
Is a 95% gross collection rate realistic?
Almost never. It would mean billing only about 5% more than payers allow. In 2024 Medicare data, none of 29 common office services came close. The highest was 67.3%.
Is adjusted collection rate the same as net collection rate?
Yes. AAFP calls it the adjusted collection rate. MGMA calls it the adjusted fee-for-service collection percentage and lists "net collection percentage" as another name. The names match, but check that the write-offs are handled the same way before comparing two reports.
What is MGMA's benchmark for net collection rate?
We could not find an MGMA page that sets 95% as its benchmark. MGMA's test for a top performer is beating the median. The medians it has published in the open ran from 96.12% to 99.24% for 2017 to 2021, and 100.0% for top performers in 2020.
What is a matched net collection rate?
It is a net collection rate where each payment is tied to the visit that earned it, by date of service. It takes longer to settle, because recent visits are still being paid. It is the cleanest way to see how one month's work turned out.
Can net collection rate be over 100%?
Yes, for a short stretch. Payments for older visits can land in a month with few new charges. Over a full year matched by date of service, a rate that stays above 100% points to a data problem.
How much is one point of net collection rate worth?
One percent of your collectible charges, or $10,000 for every $1 million. At the median multispecialty group that was about $7,400 per physician per year (MedicalBillingSelect math on MGMA 2020 data).
What net collection rate should a billing company deliver?
There is no published promise to hold one to. For scale, billing companies in HBMA's survey averaged 84.86% for office-based work and 93.22% for hospital-based work, and AAFP's minimum is 95%. Ask for the company's number and its math. These questions to ask for your practice are a good place to start.
Sources
All sources were checked on October 5, 2026.
- American Academy of Family Physicians. Practice finances and revenue cycle management. https://www.aafp.org/practice-operations/practice-finances
- MGMA. Data Mine: Measuring success - Finding the right metrics to optimize the revenue cycle. December 14, 2021. https://www.mgma.com/articles/data-mine-measuring-success-finding-the-right-metrics-to-optimize-the-revenue-cycle
- MGMA. Data Mine: COVID-19's impact on the revenue cycle. August 11, 2023. https://www.mgma.com/articles/data-mine-covid-19-s-impact-on-the-revenue-cycle
- Healthcare Business Management Association. Data Science Committee Survey Results. RCM Advisor, Quarter 1 2024, Volume 29, Issue 1. https://www.hbma.org/rcmadvisor/quarter-1-2024-volume-29-issue-1/data-science-committee-survey-results
- MGMA. Cost and Revenue Glossary: formulas. https://www.mgma.com/cost-rev-formulas
- MGMA. Cost and Revenue Glossary: charges and revenue. https://www.mgma.com/cost-rev-charges-and-revenue
- MGMA. Keys to Medical Practice Excellence in 2024: Better Performers. December 2023. https://www.mgma.com/getkaiasset/b6602f6b-c19a-417f-beca-ab060f7acd93/DD-BetterPerformers-December-2023.pdf
- Rezen J. Insurance revenue cycle management. MGMA. February 20, 2025. https://www.mgma.com/articles/insurance-revenue-cycle-management
- Rezen J. Personal Pay Revenue Cycle Management. MGMA. February 20, 2025. https://www.mgma.com/articles/personal-pay-revenue-cycle-management
- Centers for Medicare & Medicaid Services. Medicare Physician & Other Practitioners - by Geography and Service. 2013 and 2024 data. Page last modified May 21, 2026. https://data.cms.gov/provider-summary-by-type-of-service/medicare-physician-other-practitioners/medicare-physician-other-practitioners-by-geography-and-service
- Centers for Medicare & Medicaid Services. Data dictionary for the dataset above. Last modified October 30, 2024. https://data.cms.gov/resources/medicare-physician-other-practitioners-by-geography-and-service-data-dictionary
- Denny J. Manage Four Key Revenue Cycle Metrics. AAPC. December 1, 2012. https://www.aapc.com/blog/24475-manage-four-key-revenue-cycle-metrics/
- HFMA. 7 KPIs providers should be tracking. Sponsored by Conifer Health Solutions. April 6, 2023; updated September 11, 2024. https://www.hfma.org/revenue-cycle/kpis/7-kpis-providers-should-be-tracking/
- Guira PA. Four Steps for Improving Efficiency and Cash Flow. Family Practice Management. 1999;6(9):14-15. https://www.aafp.org/pubs/fpm/issues/1999/1000/p14.html
- Physicians Practice. Understanding Collection Rates. October 1, 2005. https://www.physicianspractice.com/view/understanding-collection-rates
- Bai G, Anderson GF. Variation in the Ratio of Physician Charges to Medicare Payments by Specialty and Region. JAMA. 2017;317(3):315-318. https://jamanetwork.com/journals/jama/fullarticle/2598253
- KFF. Claims Denials and Appeals in ACA Marketplace Plans in 2024. https://www.kff.org/private-insurance/issue-brief/claims-denials-and-appeals-in-aca-marketplace-plans-in-2024/
- Kodiak Solutions. Rate of initial denials of medical insurance claims continued to rise in 2024. May 21, 2025. https://www.businesswire.com/news/home/20250521892947/en/Rate-of-initial-denials-of-medical-insurance-claims-continued-to-rise-in-2024-Kodiak-Solutions-proprietary-data-show
- Becker's ASC Review. ASC administrators, remember this number: 97%. June 13, 2019. https://www.beckersasc.com/asc-coding-billing-and-collections/asc-administrators-remember-this-number-97/
- XiFin. Key RCM Metrics Your Organization Should Monitor (and Why). March 22, 2019. https://www.xifin.com/resource/blog-post/key-rcm-metrics-your-organization-should-monitor-and-why/
See something that has changed? Report an error.
MedicalBillingSelect Research is the research and reference section of medicalbillingselect.com.