Medical Billing Industry Statistics: 86 Sourced Facts for 2026
By MedicalBillingSelect · Updated October 2026
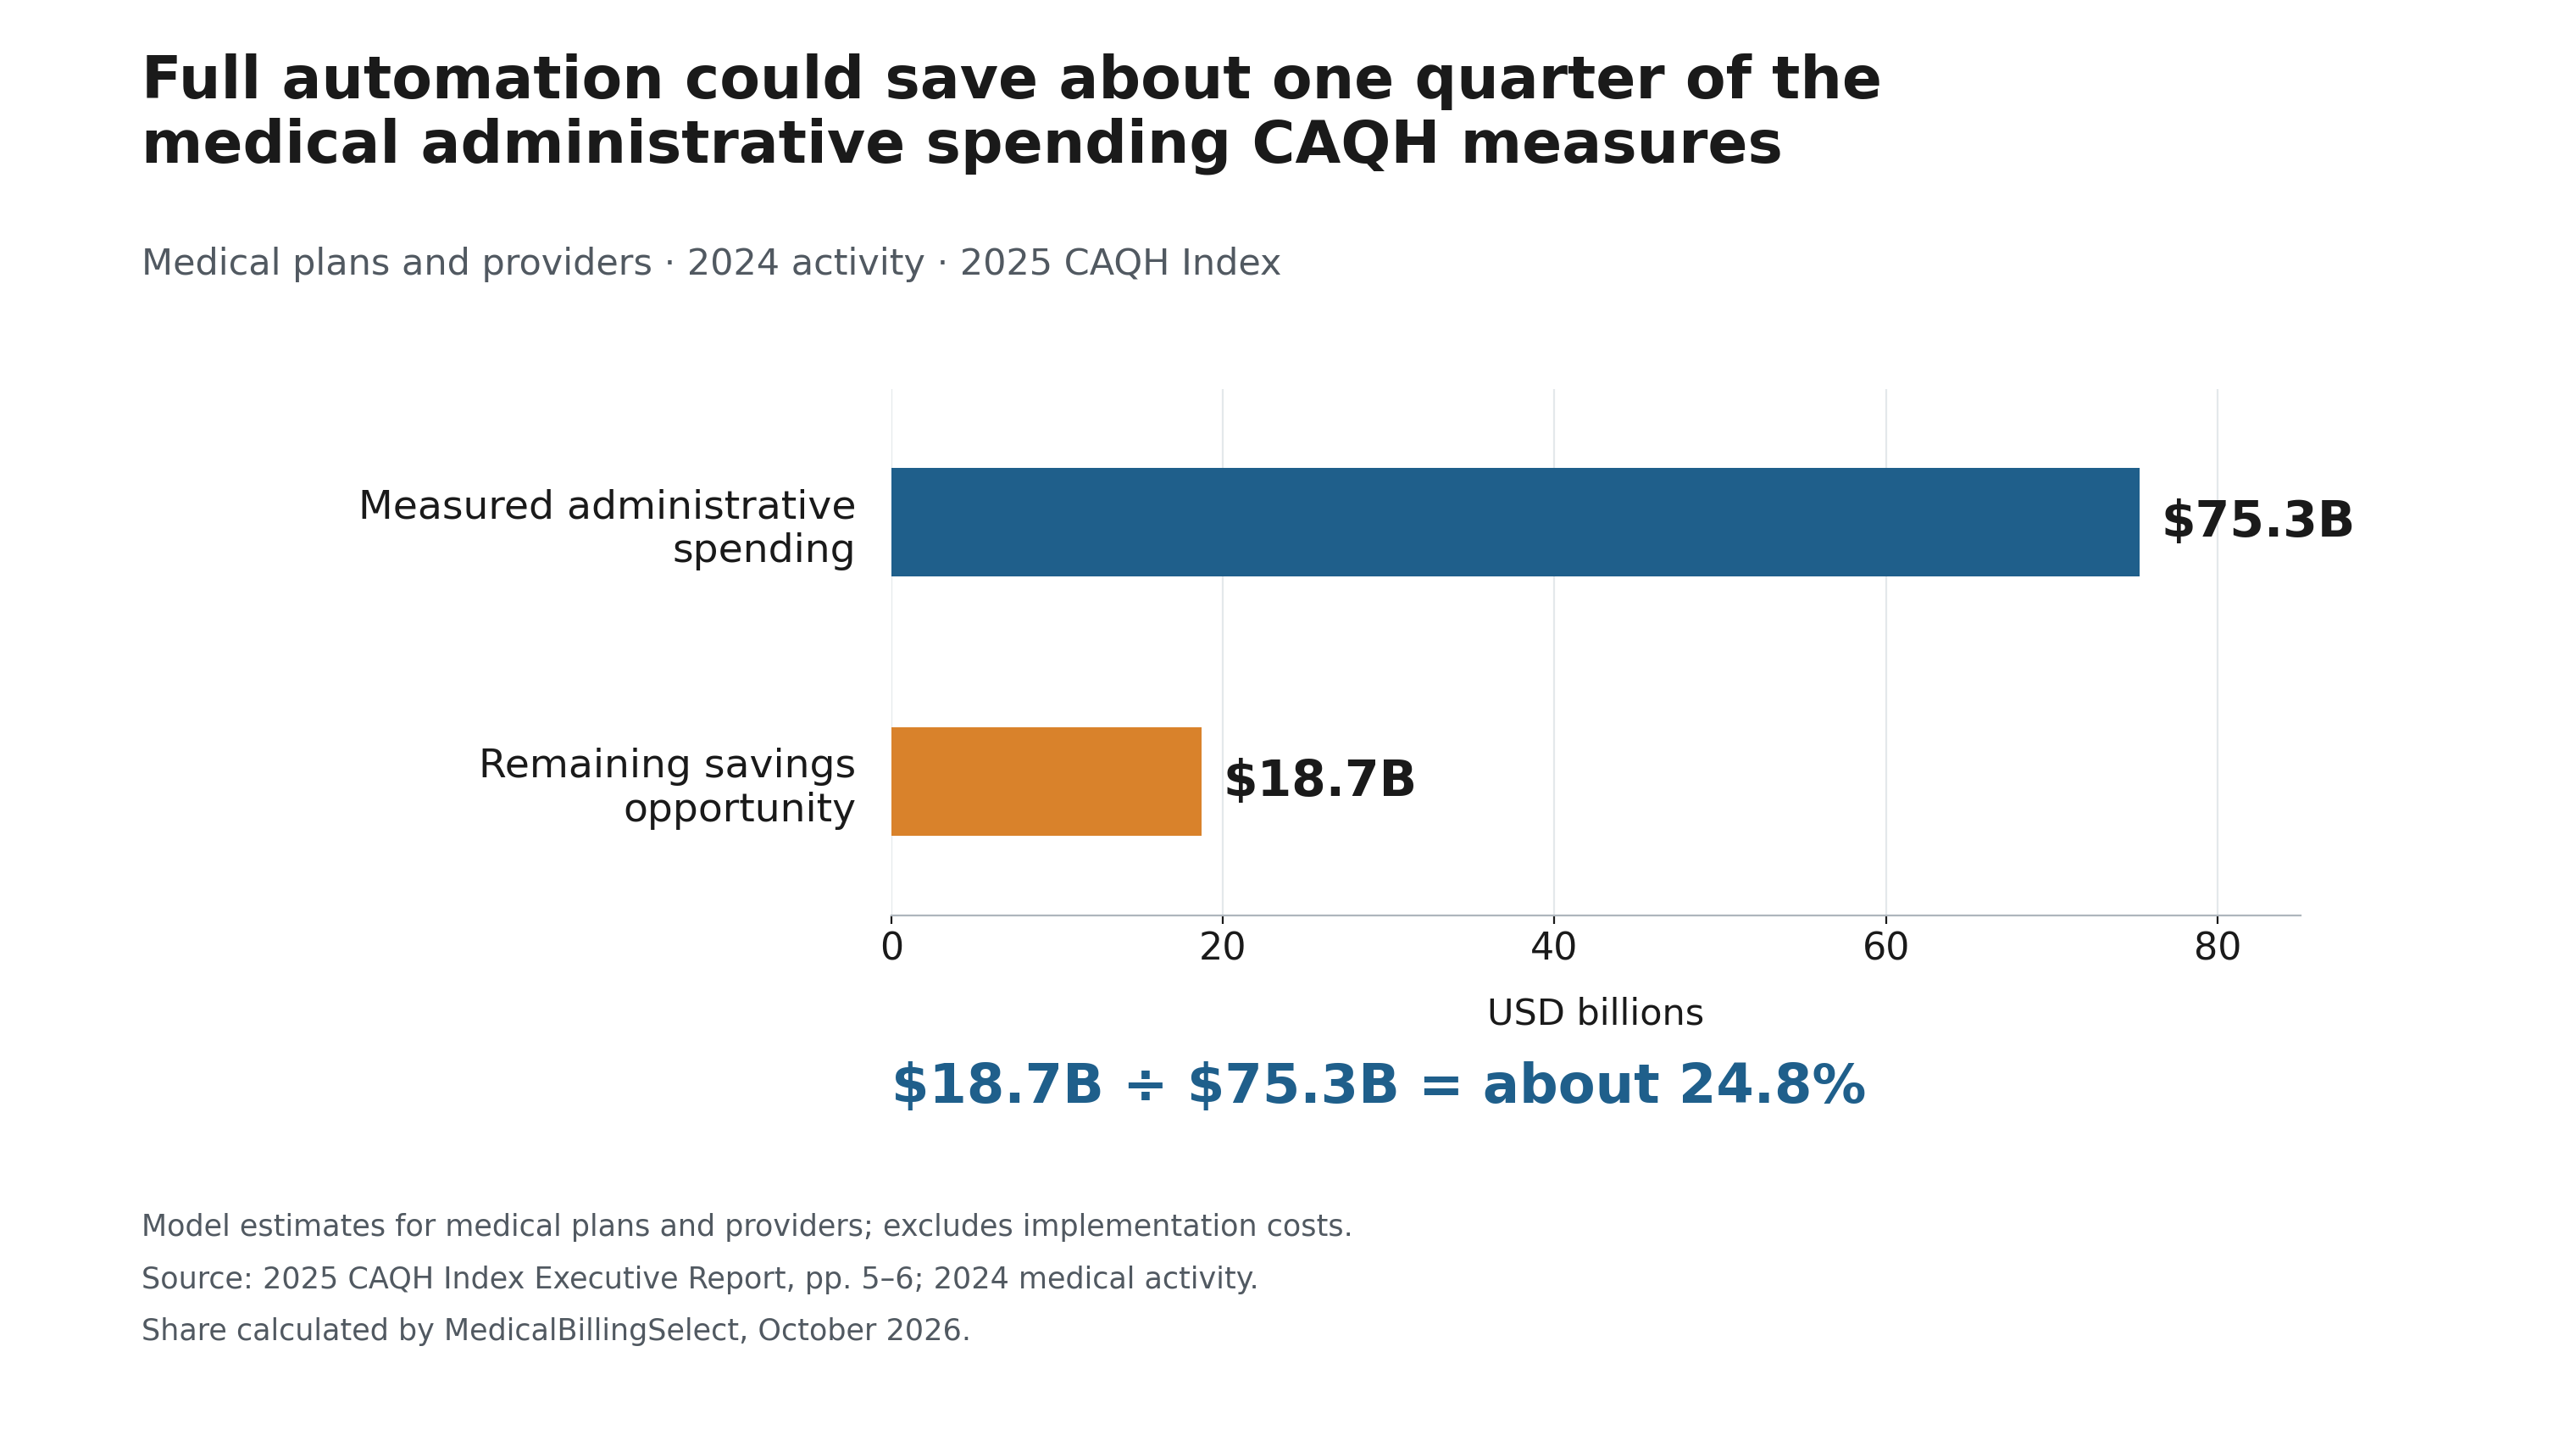
About 24.8% of the medical administrative spending CAQH measures could be saved through full automation. MedicalBillingSelect calculated that share from CAQH’s $18.7 billion savings estimate and $75.3 billion spending estimate, both based on 2024 activity.
The U.S. medical billing market is worth an estimated $4.2 billion to $7.7 billion in 2026, depending on what is counted. Each of the medical billing industry statistics below says what it counts.
Key medical billing industry statistics
- About 24.8% of CAQH’s measured medical administrative spending could be saved through full automation—$18.7 billion out of $75.3 billion, based on 2024 activity (MedicalBillingSelect calculation from the 2025 CAQH Index).
- Insurers on HealthCare.gov denied 19% of in-network claims in 2024, about 85 million of 451 million (KFF analysis of CMS data, March 2026).
- HealthCare.gov insurers reported at least 262,982 internal appeals in 2024; insurers upheld the denial in 66% of appeals among issuers with usable outcome data. The appeals count combines network types (KFF; CMS data definitions).
- Medicare Advantage insurers denied 7.7% of nearly 53 million prior authorization determinations in 2024; 80.7% of appeal decisions that year overturned the denial in full or in part (KFF analysis of CMS data).
- Estimates of the U.S. medical billing market in 2026 run from $4.2 billion to $7.73 billion (IBISWorld; Grand View Research, which also counts in-house billing).
- Two selected federal job groups related to medical billing and coding totaled about 378,800 jobs in 2025: medical records specialists and billing clerks on health care and social assistance payrolls (MedicalBillingSelect calculation from Bureau of Labor Statistics data).
- Medical records specialists, the federal job category that includes medical coders, earned a median $51,140 in May 2025, with 8% job growth projected from 2025 to 2035 (Bureau of Labor Statistics).
- Fighting one denied claim cost hospitals in Premier’s survey an average of $57.23 in 2023, up from $43.84 in 2022 (Premier survey of member hospitals).
- Medical plans reported that 98% of claim submissions were fully electronic, but only 40% of prior authorizations and 24% of attachments (2025 CAQH Index, 2024 activity).
- Practices completed an average of 40 prior authorizations per physician each week, taking 13 combined hours of physician and staff time per physician (American Medical Association survey of 1,000 physicians, December 2025).
- Five CMS programs reported federal improper-payment estimates totaling $95.5 billion for fiscal 2025, up 10.4% from $86.5 billion (MedicalBillingSelect calculation from CMS figures). Improper payments are not a measure of fraud.
- Traditional Medicare's improper payment rate fell to 6.55% in fiscal 2025, from 7.66% (CMS).
- 54% of billing-company respondents expected gross margins of 10% or less for 2025, and 46% said denial rates had risen (Tebra survey of 190 respondents, December 2025).
- Hospitals on Kodiak’s platform lost $48.4 billion to final denials and unpaid patient balances in 2025, up from $38.6 billion in 2024 (Kodiak Solutions, a platform covering more than 2,300 hospitals).
On this page: Denial rates · Appeals · Industry size · Costs · Automation · Jobs and pay · Payment errors · The 80% claim · What's changing · Method · Cite and download · FAQ
Headline finding: $18.7 billion in possible savings from $75.3 billion in measured spending
| CAQH medical estimate | Amount, 2024 activity |
|---|---|
| Spending on the administrative transactions measured | $75.3 billion |
| Remaining savings possible through full automation | $18.7 billion |
The cost table and eight-step electronic billing table explain what those estimates cover.
What percentage of medical claims are denied?
There is no single U.S. denial rate. Insurers on HealthCare.gov denied 19% of in-network claims in 2024. The figures below cover whole claims, service lines, prior authorization reviews and provider benchmarks. They answer different questions.
Why so far apart? Because "denial rate" is one phrase doing several jobs.
A claim is the bill a provider sends an insurer after care. One claim can contain several service lines. Prior authorization is permission a provider asks for before care. A first-pass denial (also called an initial denial) is a "no" on the first try, and many of those get paid later. A final denial is a "no" that sticks; a final-denial financial measure tracks the resulting write-off.
Mix those up and you can make denials look tiny or huge. So here they are, side by side, each with a label.
| Type of measure | Rate | What is counted | Data period | Source |
|---|---|---|---|---|
| Claims | 19% | In-network claims, HealthCare.gov plans | 2024 | KFF analysis of CMS data |
| Claims | 37% | Out-of-network claims, HealthCare.gov plans | 2024 | KFF analysis of CMS data |
| Claims | 20% | All claims, HealthCare.gov plans | 2024 | KFF analysis of CMS data |
| Claims | 21% | In-network claims in eight complete Covered California issuer filings | 2023 | Covered California filings |
| Claims | 14% | Claims reported by Connecticut HMOs and indemnity carriers | 2024 | Connecticut Insurance Department |
| Claims | 8.5% | Total claims in three Vermont insurer filings, including pharmacy | 2025 | Vermont Department of Financial Regulation |
| Claims | nearly 15% | Claims denied at first, Premier hospital survey | 2023 | Premier |
| Service lines | 15.5% | Individual medical claim lines in NAIC’s national insurer reporting summary; excludes pharmacy | 2025 | NAIC workbook |
| Prior authorization reviews | about 23% | Completed reviews not provisionally affirmed in three traditional Medicare programs | FY2024 | CMS program statistics |
| Prior authorization requests | 7.7% | Medicare Advantage prior authorization determinations | 2024 | KFF analysis of CMS data |
| Prior authorization requests | 12% | Skilled-nursing admission requests, 19 Medicare Advantage insurers | June 2024 | HHS Office of Inspector General |
| Prior authorization requests | 12.5% | Requests in 115 selected Medicaid managed care organizations, not all Medicaid plans | 2019 | HHS Office of Inspector General |
| Provider benchmark | 11.6% | Kodiak average initial-denial rate; annual chart does not give the count-versus-dollar formula | 2025 | Kodiak original report |
| Provider benchmark | 2.7% | Kodiak median final-denial rate; do not interpret as the share of claims left unpaid | 2025 | Kodiak original report |
Kodiak’s public KPI descriptions measure final denial write-offs against net patient service revenue, while its annual charts do not print the exact formulas. Its initial and final figures also use different averages. Don't subtract one from the other or read 2.7% as a share of claims. Before quoting a denial rate, check what it divides by: whole claims, service lines, requests or dollars. Then check whether it counts the first denial or the final outcome.
How much do denial rates vary by insurer and by state?
A lot. Among HealthCare.gov insurers, in-network denial rates ran from 3% to 36% in 2024. By state, the share of in-network claims denied ran from 7% in South Dakota to 27% in Hawaii (KFF analysis of CMS data).
State averages can hide the action. Texas sat near the national average, yet its insurers ranged from 12% to 36%. Same state, three times the denial rate, depending on the insurer.
Which payers deny the most claims at first?
In a Premier survey about 2023 claims, hospitals reported that Medicaid denied 28.5% of claims at first and traditional Medicare 7.3%. That's roughly four times the first-pass denial rate for traditional Medicare.
| Payer type | Claims denied at first |
|---|---|
| Medicaid | 28.5% |
| Managed Medicaid | 16.2% |
| Managed Medicare (Medicare Advantage) | 15.0% |
| Commercial | 13.2% |
| Traditional Medicare | 7.3% |
| All payers | nearly 15% |
Kodiak reported a 5.0% final-denial measure for Medicare Advantage and 1.9% for traditional Medicare in 2025 (Kodiak’s original report). These are provider benchmarks, not verified shares of claim counts.
Why do claims get denied?
Among the reasons HealthCare.gov plans gave for in-network denials in 2024, 25% were administrative and 5% were medical necessity. The largest category, 36%, was “other.”
| Reason | Share of denial reasons |
|---|---|
| "Other" (not specified) | 36% |
| Administrative (duplicate, missing information, late, and similar) | 25% |
| Service excluded by the plan | 13% |
| No prior authorization or referral | 9% |
| Not medically necessary | 5% |
If you're sizing up a billing service, ask who chases denials and what reports you'll see. Our questions to ask for your practice cover that ground.
How often are denials appealed, and how often do appeals win?
Appeals are rare compared with reported denials, but many decided appeals succeed. HealthCare.gov insurers reported at least 262,982 internal appeals in 2024. That count combines network types. In Medicare Advantage, appeal decisions were 11.5% of initial denials reported in 2024, and 80.7% of those appeal decisions overturned the denial in full or in part.
| Where | Denial measure | Appeals reported | What happened on appeal | Recorded reversals as a share of initial denials |
|---|---|---|---|---|
| HealthCare.gov plans, 2024 | 19% of in-network claims; 20% of all claims | At least 262,982 internal appeals; no network split | Denial upheld in 66% of appeals among issuers with usable outcome data | Not established for a linked request group |
| Prior authorization, Medicare Advantage, 2024 | 7.7% of initial determinations | Annual appeal decisions equal 11.5% of annual initial denials | 80.7% overturned in full or in part | Not established for a linked request group |
| Skilled-nursing admission requests, 19 Medicare Advantage insurers, June 2024 | 12% | About 18% of initial denials appealed in the study data | 2,313 of 2,445 decided appeals overturned: about 95% | 2,313 ÷ 13,458 = about 17.2% |
Here's the nursing-facility row as requests. Picture 1,000 denied requests. On the outcomes OIG recorded, about 172 had an appeal reversal. The study did not decide whether every original denial was medically right or wrong.
That's the part writers often miss. A low reversal total does not prove the other denials were right, and a high success rate among appealed denials does not show that all denials were wrong.
How big is the medical billing industry?
For 2026, three publishers put the U.S. market between $4.2 billion and $7.73 billion. These are estimates with different market definitions. Separately, two selected federal job groups related to billing and coding add up to about 378,800 jobs in 2025.
| Publisher | What it counts | Estimate | Trend or forecast |
|---|---|---|---|
| IBISWorld | U.S. medical billing services, including billing software and consulting/support | $4.2 billion (2026) | Shrank about 2.2% a year, 2021 to 2026 |
| Dimension Market Research | U.S. medical billing, in-house plus outsourced | $5.9 billion (2024 estimate; 2023 base year) | $16.9 billion by 2033 |
| Towards Healthcare | U.S. medical billing outsourcing | $6.42 billion (2025); $7.24 billion (2026 forecast) | $21.41 billion by 2035 |
| Grand View Research | U.S. medical billing, in-house plus outsourced | $6.95 billion (2025); $7.73 billion (2026 forecast) | $17.69 billion by 2033 |
| Fortune Business Insights | Global medical billing software | $20.25 billion (2025); $22.34 billion (2026 forecast) | $49.1 billion by 2034 |
The top estimate for 2026 is 1.8 times the bottom one (7.73 ÷ 4.2 = 1.84). Their market definitions differ; the public pages do not say how much of the gap each difference explains.
Grand View's number includes billing that practices and hospitals do in-house. It says outsourced work was 58.41% of the 2025 total. Apply that to its $6.95 billion for 2025 and you get about $4.06 billion. That calculation stays within Grand View’s definition and year.
The time periods differ too. IBISWorld reports a 2021–2026 decline and forecasts growth ahead. Grand View and Towards Healthcare forecast future growth of more than 12% a year. If you quote a market size, name the publisher and say what it counts.
How many medical billing companies are there?
IBISWorld estimates 1,600 medical billing businesses in the U.S. in 2026 and says no single company holds more than 5% of the market (IBISWorld). That is an estimate too, not a registry count.
Tebra’s survey sample skewed toward small firms. In its December 2025 survey, 48% of billing-company respondents reported 2024 gross revenue under $250,000, and 68% reported under $500,000 (Tebra, 190 respondents).
How are billing companies doing?
Tight margins, more competition. In the same Tebra survey, 54% of respondents expected gross margins of 10% or less for 2025. Gross margin is what's left after the direct cost of doing the work, before overhead.
| Measure | Share of respondents |
|---|---|
| Expected gross margin of 10% or less for 2025 | 54% |
| Denial rates rose in the past 12 months (28% said so a year earlier) | 46% |
| Firm gross revenue under $250,000 in 2024 | 48% |
| Firm gross revenue under $500,000 in 2024 | 68% |
| Firm is highly focused on specific specialties | 57% |
| More competition for new business | 54% |
| Firm has not adopted any AI | 59% |
| Believe payers use AI to drive denials | 67% |
What does medical billing cost?
The U.S. medical industry spent an estimated $75.3 billion on the administrative transactions measured in the 2025 CAQH Index, which uses 2024 activity. A manual transaction cost a medical provider $8.03 on average, against $2.65 for an electronic one. Fighting one denied claim cost hospitals in Premier’s survey $57.23 in 2023.
| Measure | Figure | Period | Source |
|---|---|---|---|
| Spending on routine administrative transactions, medical | $75.3 billion | 2024 activity | CAQH Index |
| Medical administrative transaction volume, including acknowledgments | 68.8 billion | 2024 activity | CAQH Index |
| Provider cost, manual transaction | $8.03 | 2024 activity | CAQH Index |
| Provider cost, electronic transaction | $2.65 | 2024 activity | CAQH Index |
| Hospital survey: cost to fight one denied claim | $57.23 | 2023 claims | Premier |
| Same, a year earlier | $43.84 | 2022 claims | Premier |
| Government administration and non-medical insurance expenditures, share of U.S. health spending | 7.0% | 2024 | CMS national health accounts |
CMS’s 7.0% category also includes insurer profits or losses, reserve changes and taxes; it does not measure the total cost of medical billing (CMS definitions).
The reported manual provider-cost average was about 3.0 times the electronic average (8.03 ÷ 2.65 = 3.03), a $5.38 difference. These are averages across workflows, not a price for each phone call or fax.
Where does the "$25.7 billion spent fighting denials" figure come from?
It's an estimate from one hospital survey, scaled up to the whole country. Premier took 3 billion claims a year, a 15% first-pass denial rate, and $57.23 per denied claim: 3,000,000,000 × 0.15 × $57.23 = $25.7535 billion (Premier).
Those published inputs give about $25.8 billion when rounded to one decimal. Premier reports $25.7 billion; its public method does not explain the small difference. The denial rate and the cost come from hospitals in Premier's network, and the 3 billion claims figure is an older approximate input, not a measured 2023 count. Its source trail leads to the 2019 CAQH Index, whose national claim-submission estimate was 3.641 billion, based on 2018 medical-plan activity. Premier also says 68.6% of those denials were paid in the end, which is how it gets to nearly $18 billion spent arguing over claims that got paid anyway. Its stated 23% cost increase does not match the published $25.7 billion and $19.7 billion amounts; those imply about 30.5%.
How much time does prior authorization take?
Practices complete an average of 40 prior authorizations per physician each week, using 13 combined hours of physician and staff time, according to the American Medical Association's survey of 1,000 practicing physicians in December 2025. Forty percent of respondents had staff who worked only on prior authorization. (You may still see "39 a week" around. That was the previous year's survey.)
Thirteen hours is about 1.6 eight-hour workdays of combined time per physician, every week.
What do billing companies charge?
In Tebra's December 2025 survey, 63% of billing-company respondents said they charge 7.99% of collections or less, and 28% said they use a pricing model that isn't a percentage at all (Tebra).
A percentage is only half the price, though. What matters is what the percentage applies to, and whether there's a monthly minimum. Our cost example shows how a minimum changes what a percentage fee really costs.
For scale: total U.S. health spending reached $5.3 trillion in 2024, or $15,474 per person (CMS).
How much of medical billing is electronic?
It depends on the step. In the 2025 CAQH Index, medical plans reported that 98% of claim submissions were fully electronic, but only 40% of prior authorizations and 24% of attachments. CAQH estimates medical plans and providers could save another $18.7 billion a year by fully automating the work still done manually or partly electronically. That is about 24.8% of the $75.3 billion spent on the administrative transactions it measures.
An attachment is the extra paperwork sent to back up a claim or request, like chart notes or test results.
| Billing step | Fully electronic | Not fully electronic |
|---|---|---|
| Claim submission | 98% | 2% |
| Eligibility and benefit verification | 96% | 4% |
| Coordination of benefits | 93% | 7% |
| Remittance advice | 87% | 13% |
| Claim status inquiry | 81% | 19% |
| Claim payment | 78% | 22% |
| Prior authorization | 40% | 60% |
| Attachments | 24% | 76% |
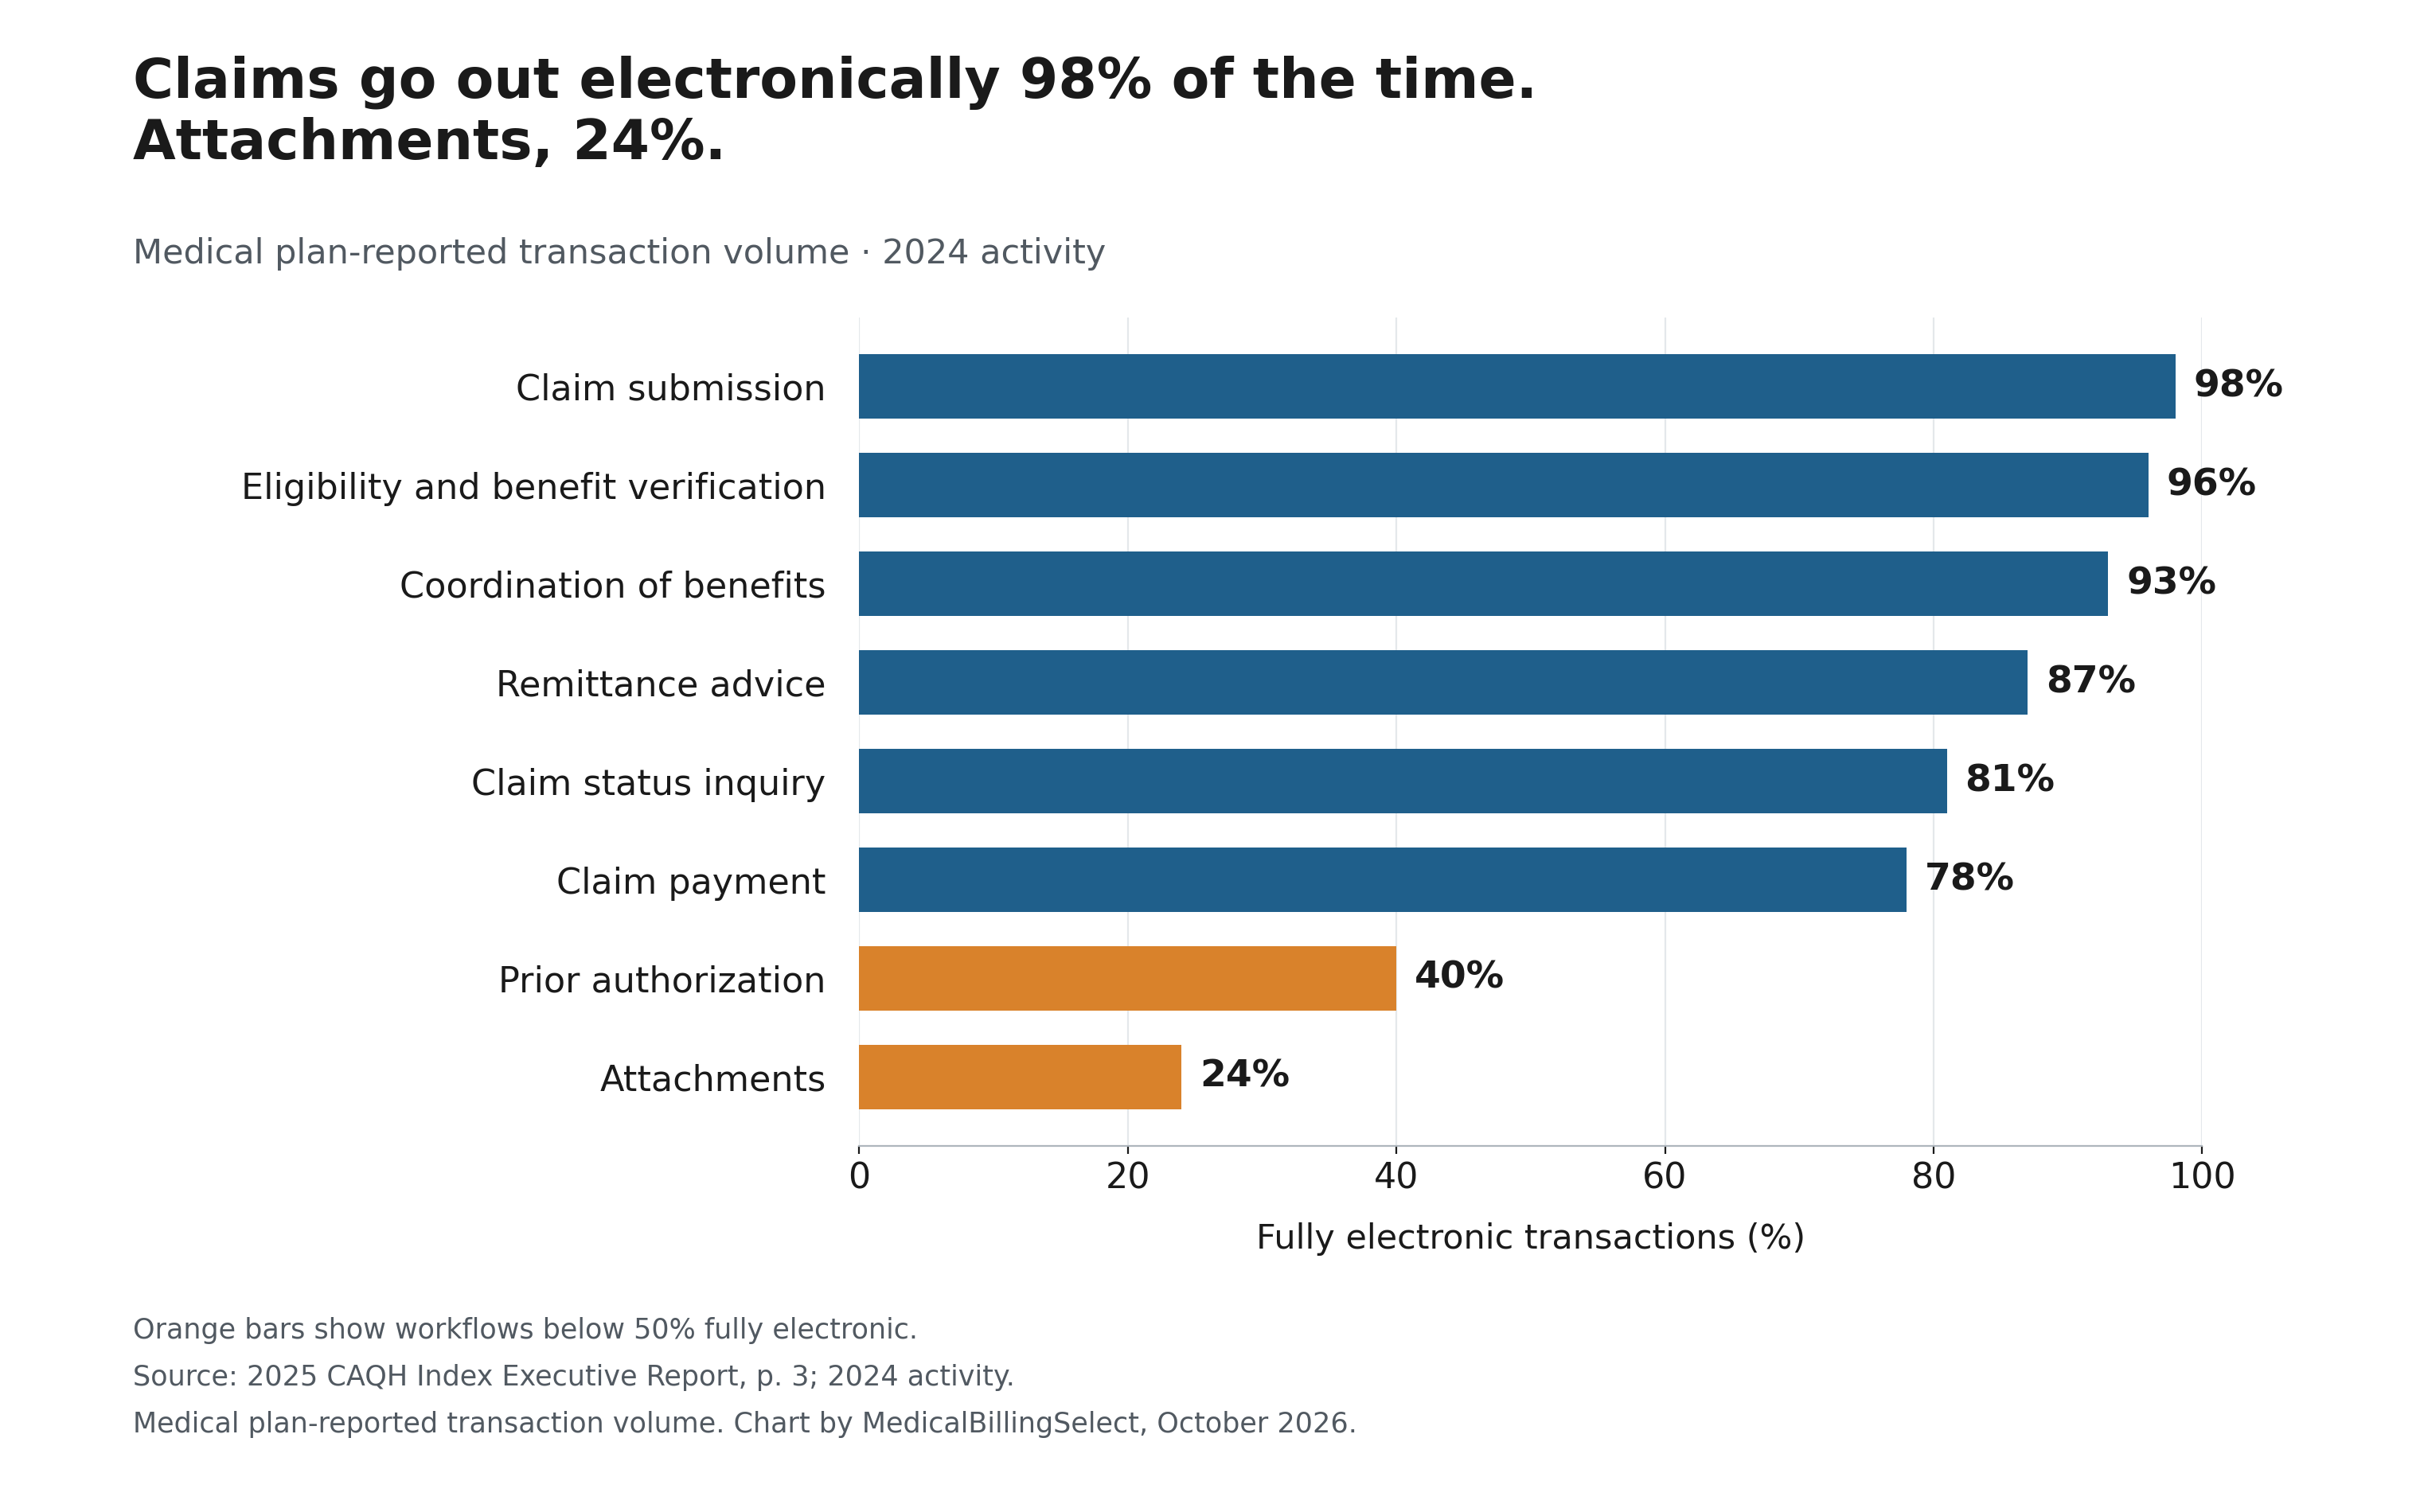
The gap between the top and bottom rows is 74 percentage points (98 − 24). Two of the eight steps are less than half electronic.
Prior authorization is moving, slowly. Its fully electronic share went from 31% to 35% to 40% across the 2023, 2024 and 2025 CAQH report editions.
One caution. The $18.7 billion is CAQH's estimate of possible savings, not money anyone has saved, and it doesn't subtract the cost of new software.
How many people work in medical billing and coding?
The Bureau of Labor Statistics has no job category called "medical biller." Two relevant groups are medical records specialists, which includes coders (200,700 jobs in 2025), and billing and posting clerks on health care and social assistance payrolls (178,100). Together that's about 378,800 jobs in these selected groups.
| Group | Jobs, 2025 | Projected, 2035 | Job change (our calculation); growth rate |
|---|---|---|---|
| Medical records specialists (includes medical coders) | 200,700 | 216,300 | +15,600 (BLS: +8%) |
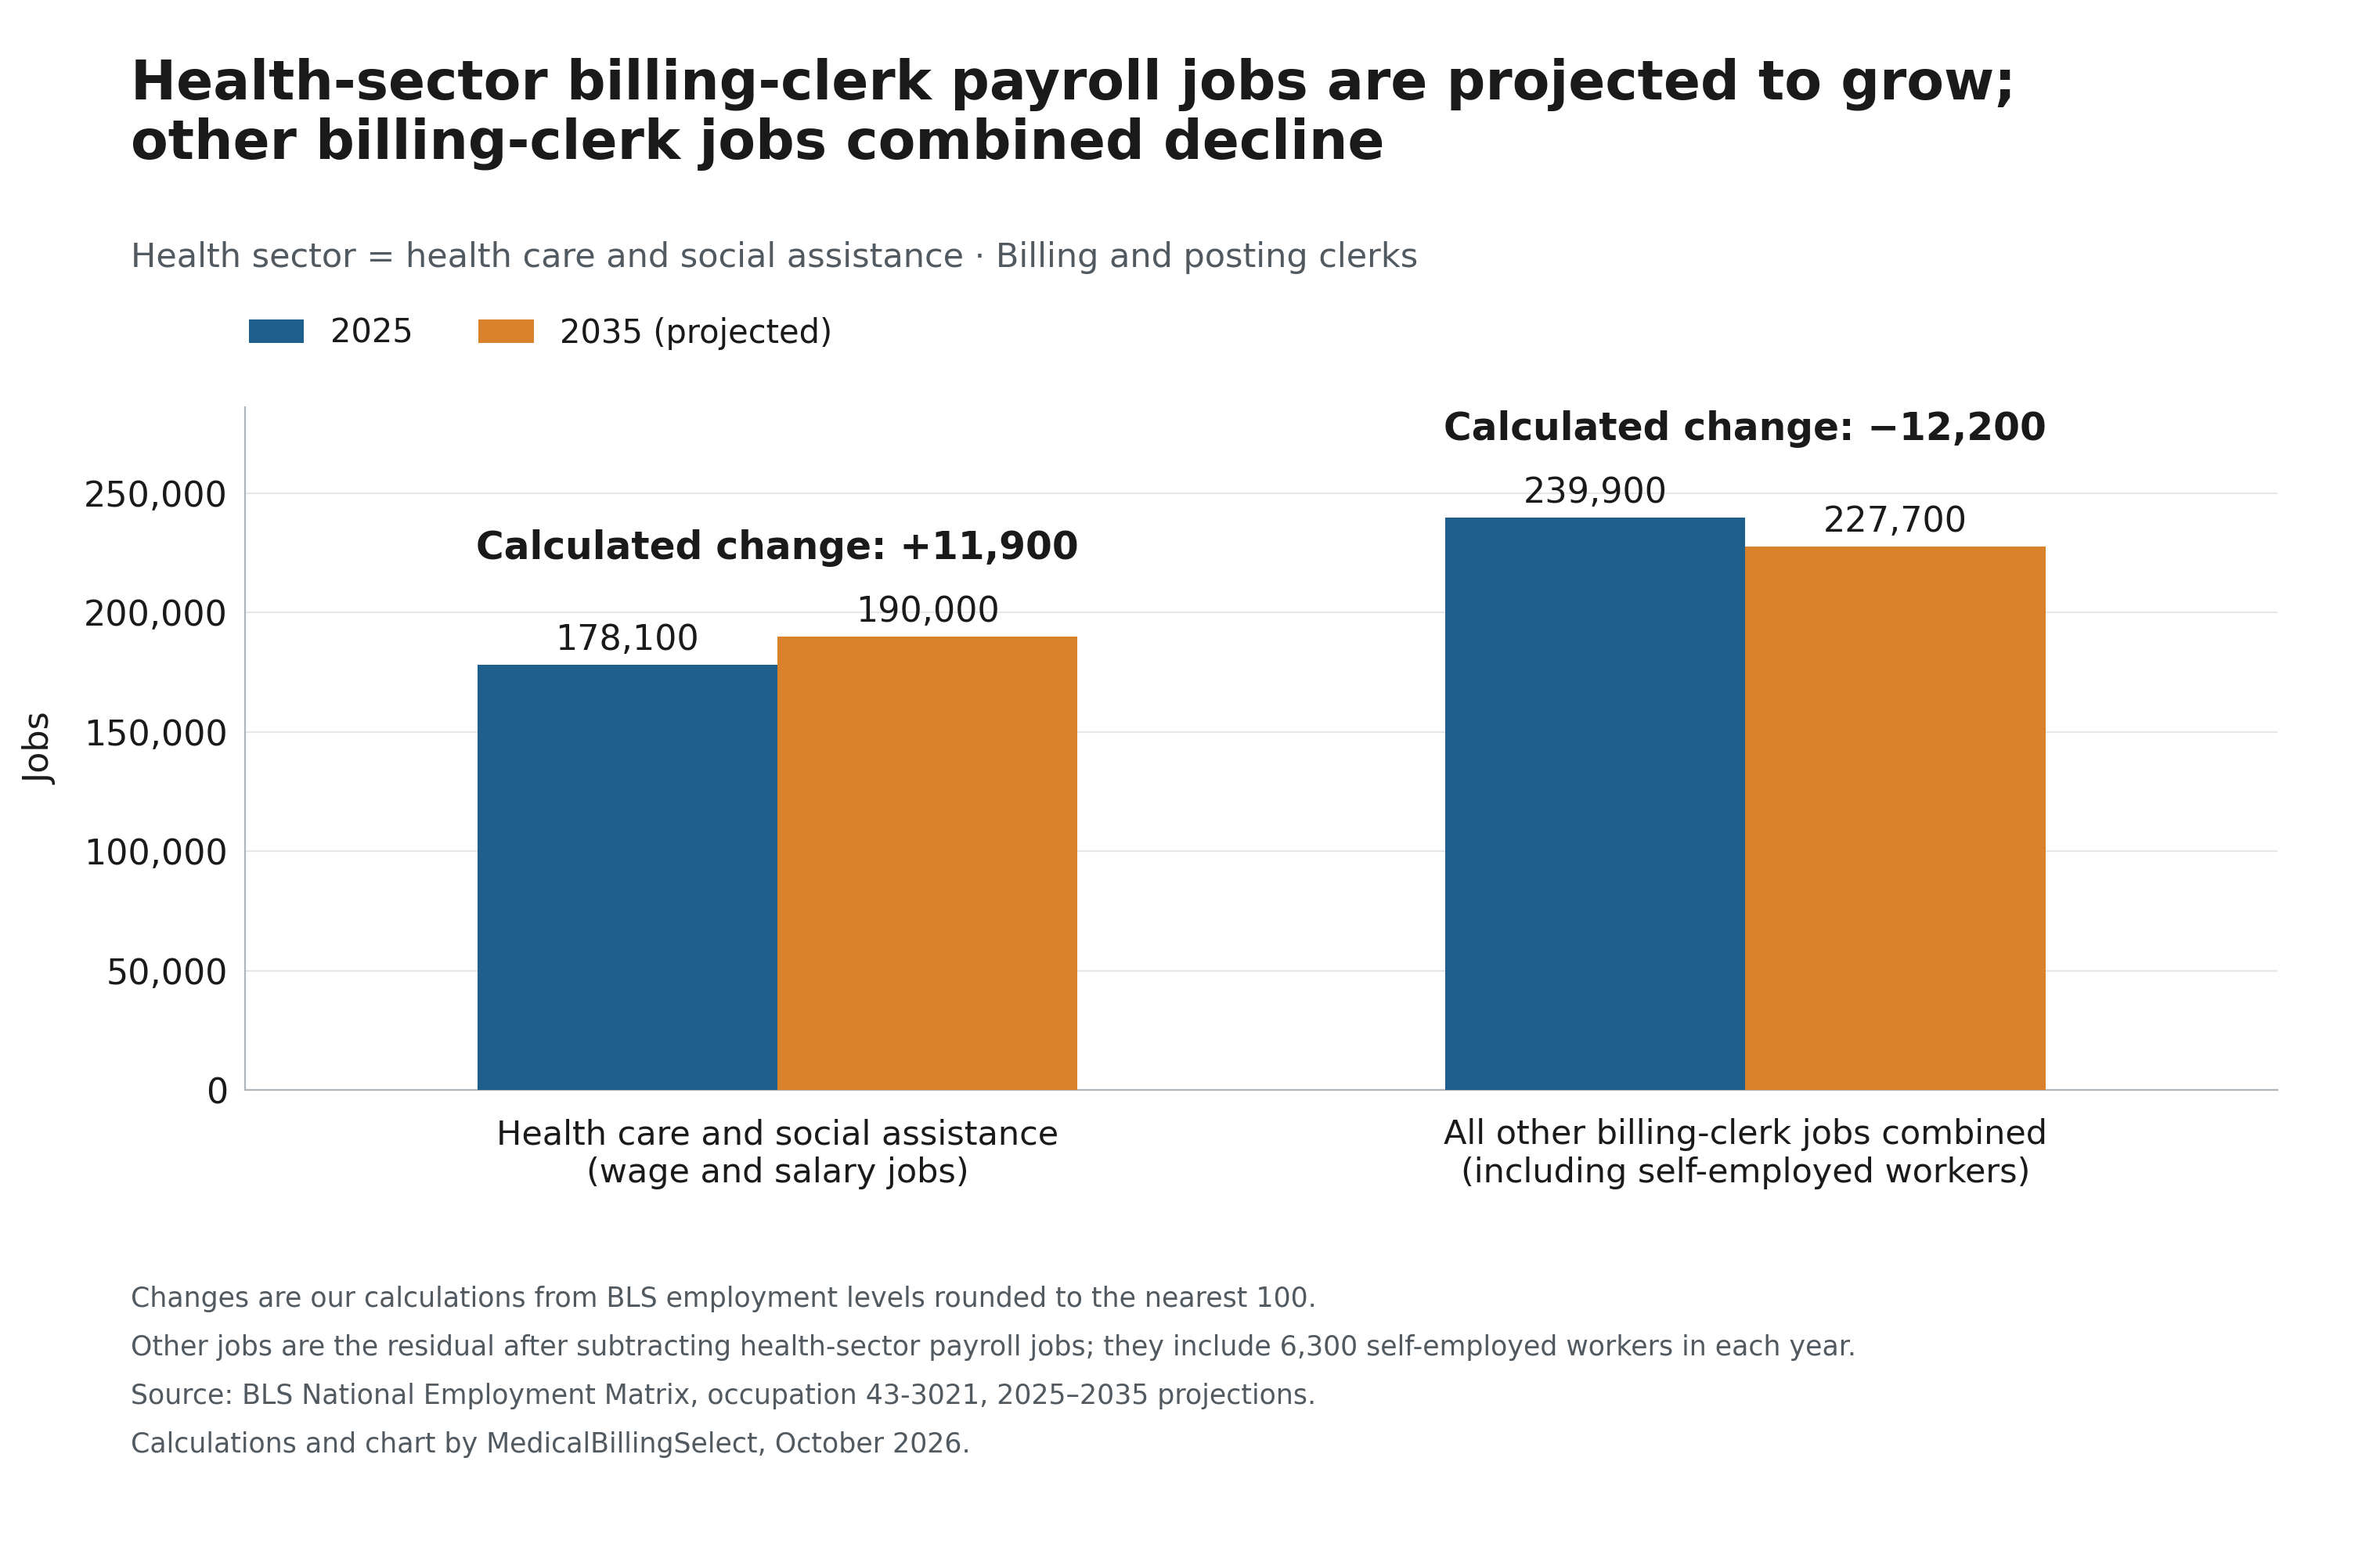
| Billing and posting clerks on health care and social assistance payrolls | 178,100 | 190,000 | +11,900 (BLS: +6.6%) |
| Combined selected groups (our addition) | 378,800 | 406,300 | +27,500 (+7.3%) |
| For comparison: all other billing-clerk jobs combined, including self-employed workers | 239,900 | 227,700 | −12,200 (−5.1%) |
This is not a count or a floor for all medical billing jobs. Both groups include work beyond billing, and the sum leaves out other job categories and some outside billing-company jobs. The medical records specialist group includes self-employed workers.
What do medical billers and coders earn?
Medical records specialists earned a median $51,140 a year ($24.59 an hour) in May 2025. The lowest-paid tenth earned under $37,000 and the highest-paid tenth over $81,150 (BLS).
Billing and posting clerks, across all industries, earned a median $48,500 ($23.32 an hour) in 2025 (O*NET, reporting BLS wage data).
"Median" means the middle: half earned more, half earned less.
Are medical billers and coders in demand?
Yes, by the federal projections. Medical records specialist jobs are projected to grow 8% from 2025 to 2035, against 3% for all jobs, with about 14,000 openings a year (BLS).
For billing clerks, health care and social assistance payroll jobs grow while all other billing-clerk jobs combined decline: up about 11,900 jobs versus a drop of 12,200, using the rounded levels above. Inside health care, growth areas include home health (+18.6%), outpatient care centers (+17.2%) and offices of other health practitioners such as therapists and chiropractors (+15.8%). Physician offices (+4.2%) and hospitals (+3.1%) grow more slowly (BLS).
Is AI taking these jobs? These projections do not isolate jobs lost to AI. The BLS adds a warning in plain words: AI tools that speed up coding "may affect the demand for these workers." Worth watching.
How much do Medicare and Medicaid pay in error?
The Centers for Medicare & Medicaid Services (CMS) reported federal improper-payment estimates totaling $95.5 billion across five programs for fiscal 2025, by our addition. Traditional Medicare's rate fell to 6.55%. CMS says improper payments are not a measure of fraud; most are payments where the paperwork couldn't prove the payment was right.
| Program | FY2024 rate | FY2024 amount | FY2025 rate | FY2025 amount |
|---|---|---|---|---|
| Medicare fee-for-service (traditional Medicare) | 7.66% | $31.70 billion | 6.55% | $28.83 billion |
| Medicare Part C (Medicare Advantage) | 5.61% | $19.07 billion | 6.09% | $23.67 billion |
| Medicare Part D (drug plans) | 3.70% | $3.58 billion | 4.00% | $4.23 billion |
| Medicaid | 5.09% | $31.10 billion | 6.12% | $37.39 billion |
| CHIP (children's coverage) | 6.11% | $1.07 billion | 7.05% | $1.37 billion |
| Total (our addition) | $86.52 billion | $95.49 billion |
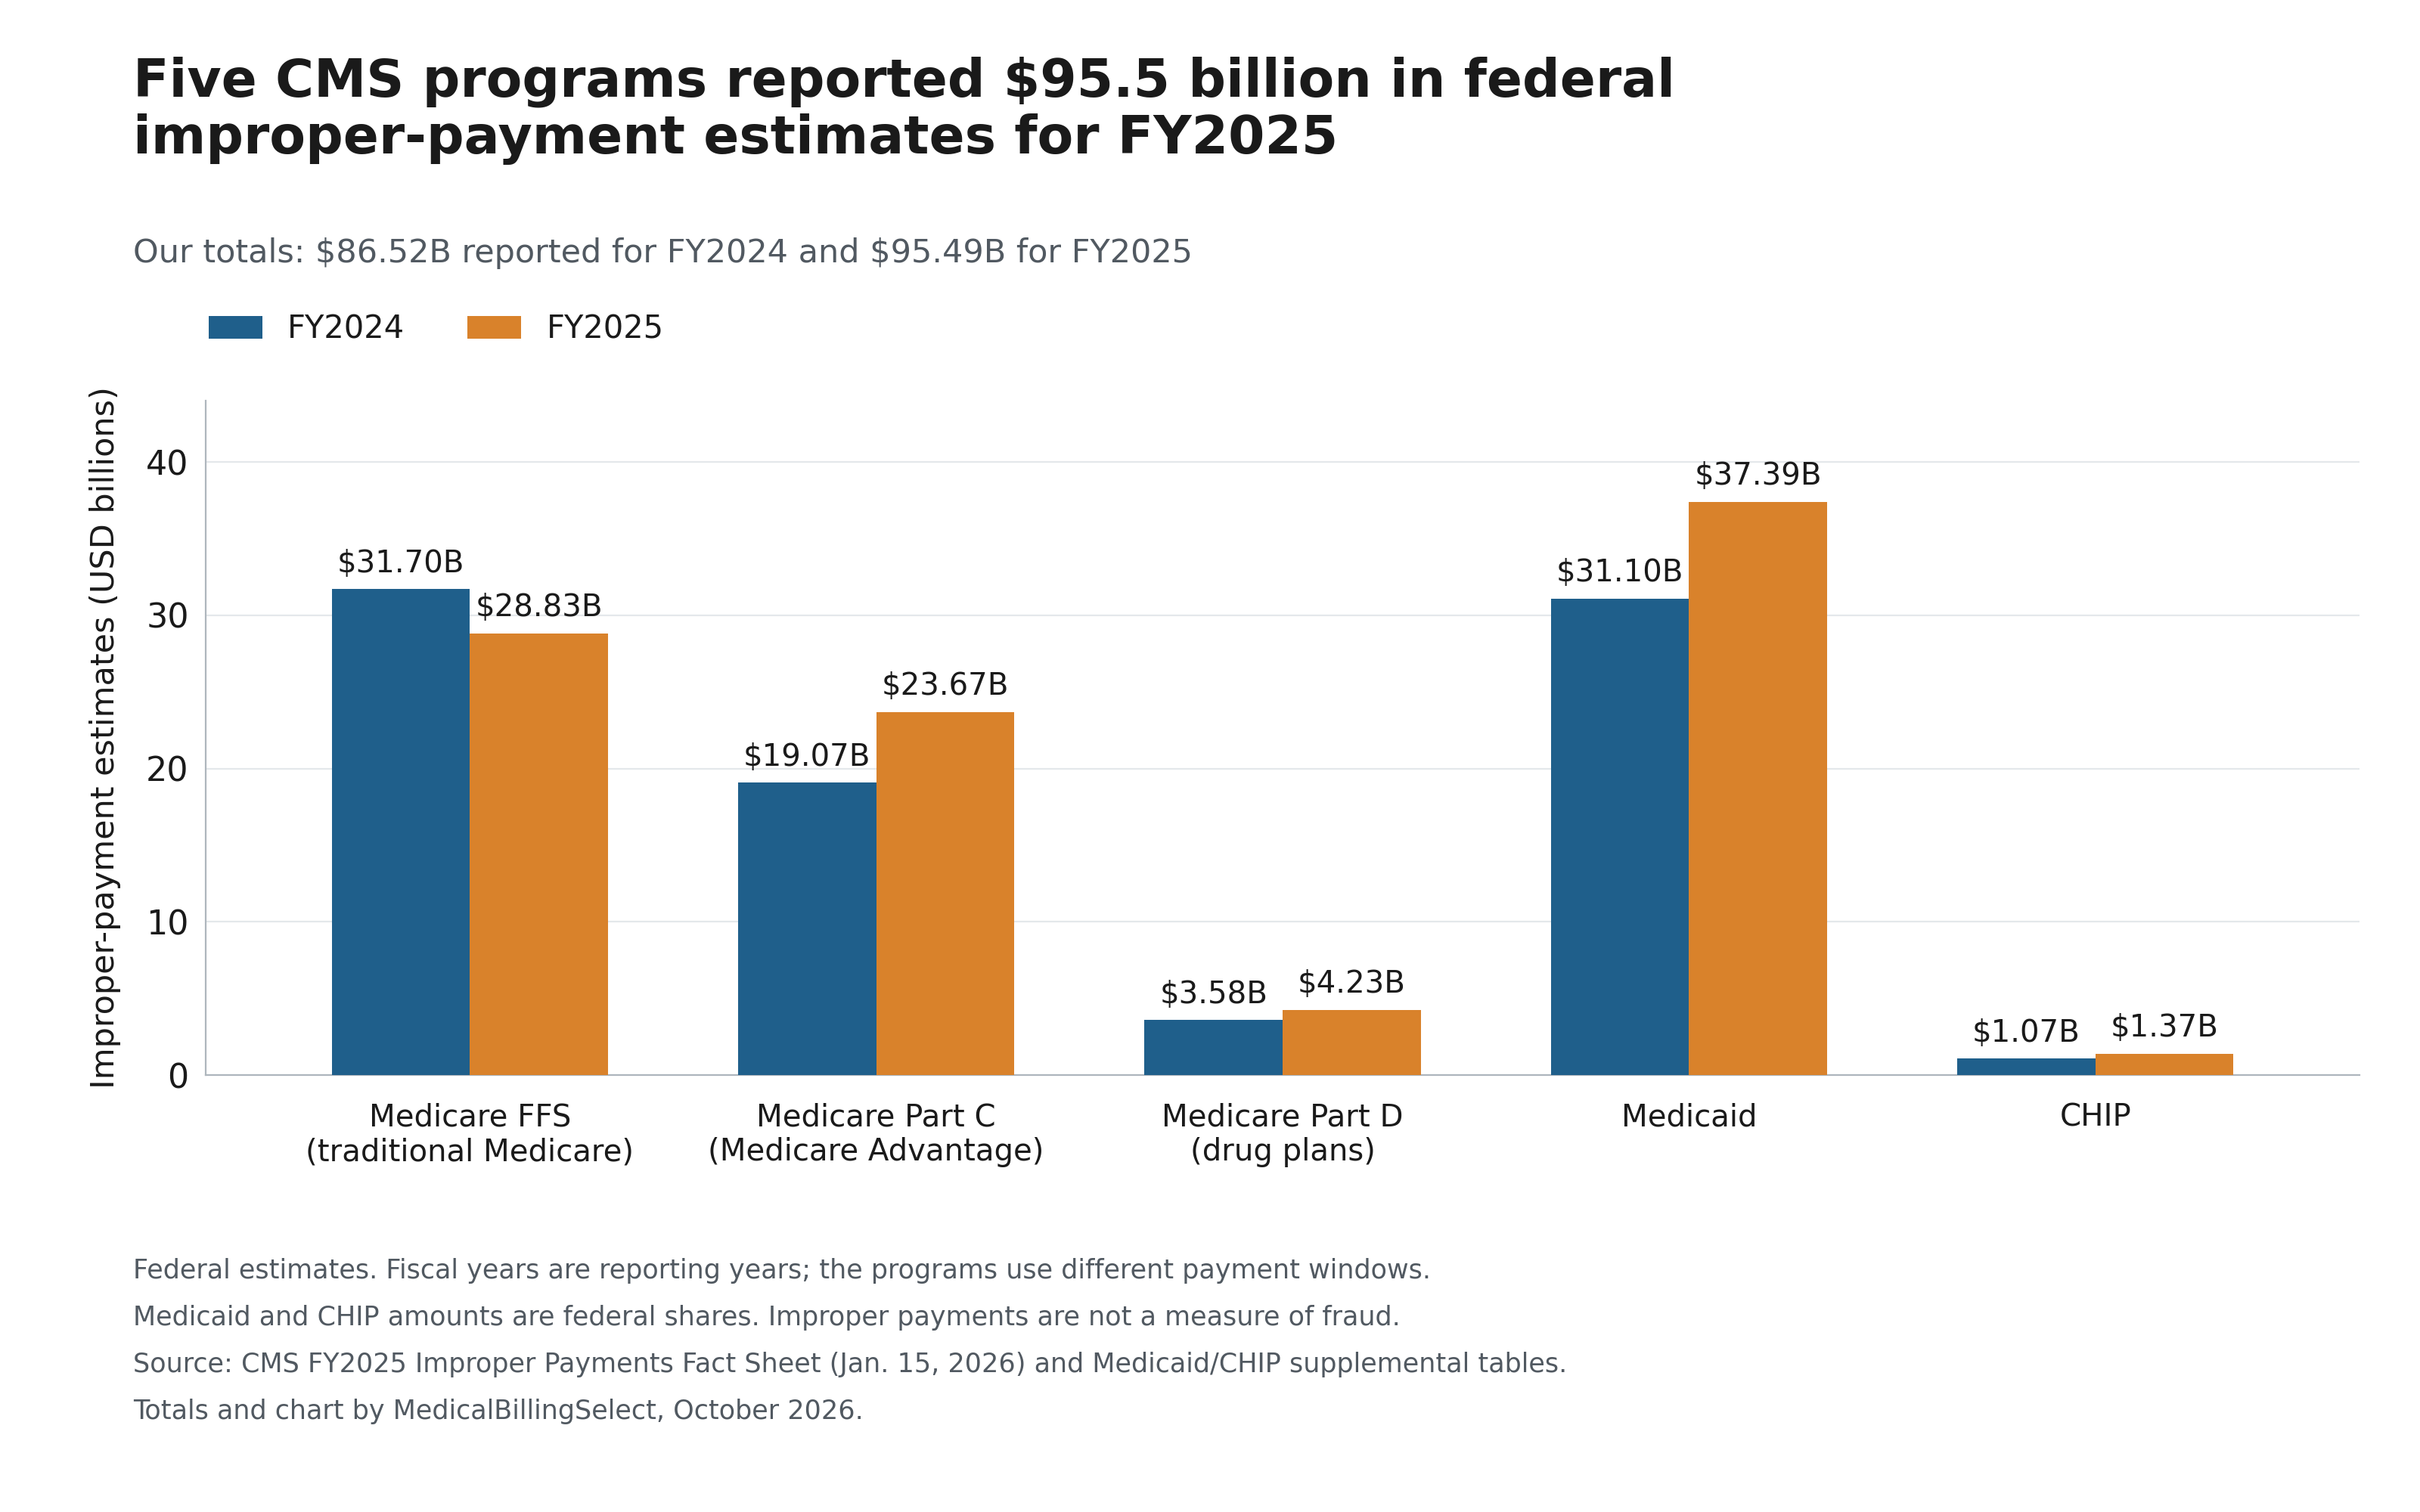
That's a 10.4% rise in the reported total (8.97 ÷ 86.52). Dividing the fiscal 2025 estimate by 365 gives about $262 million a day as a scale comparison, not measured daily payments.
Notice the split. Traditional Medicare’s reported improper-payment rate fell. Medicare Advantage’s and Medicaid’s rose. For Medicaid, CMS says 77.17% of the improper payments came from missing or insufficient documentation.
If you still see "7.66%" quoted as Medicare's rate, that's the fiscal 2024 figure. It was replaced in January 2026.
False Claims Act enforcement is a separate measure. The Justice Department reported more than $6.8 billion in False Claims Act settlements and judgments in the fiscal year that ended September 30, 2025, a record, with more than $5.7 billion from health care (Department of Justice, January 16, 2026). Settlements can resolve allegations without a finding of liability.
Do 80% of medical bills contain errors?
No current national estimate in the sources we reviewed establishes that 80% of all medical bills contain errors. One traceable source is a 2014 statement about bills clients sent a bill-review service. That selected group cannot establish a rate for all U.S. medical bills.
We traced five numbers that show up again and again in billing articles. Here's where each one leads.
| The claim | Where it traces to | Limits of the evidence |
|---|---|---|
| “80% of medical bills contain errors” | In NerdWallet's October 8, 2014 release, bill advocate Pat Palmer described errors in over 80% of bills clients sent her organization. | A statement about selected client-submitted bills; the release provides no basis for estimating the share of all U.S. medical bills with errors. |
| “Hospital bills over $10,000 contain an average error of $1,300” | A December 1990 Family Business Magazine article attributed the figure to an Equifax review of 40,000 suspicious-looking hospital bills over $10,000. ABC repeated the $1,300 figure in April 2001. | The original Equifax audit was not recovered. The article reports errors of $1,300–$1,500, about 3.5% of an average $39,283 bill. The selected sample cannot establish a current typical bill error. |
| “Doctors lose $125 billion a year to poor billing” | A November 23, 2015 In Ovations Holdings press release attributes the $125 billion claim to the trade blog Healthcare Business Tech. | We did not recover an underlying study, calculation or data year. The release documents repetition of the estimate, not its validity. |
| “It costs $25 to rework a denied claim” | A 2015 FPM article credits MGMA; its citation points to a February 2014 article by Tina Graham. A recovered reproduction repeats $25 while referring only to unspecified studies. | A historical benchmark whose underlying study and sample were not recovered. Premier's newer $57.23 figure has a different stated scope; the pair does not establish a measured cost trend. |
| “65% of denied claims are never resubmitted” | An author-byline republication of the MGMA article gives a 50–65% range for denials never worked and attributes it to unnamed industry sources; the 2015 FPM article says more than 50%. | No underlying national study was verified. Worked, resubmitted and appealed describe different actions; Table 4's appeal rates cannot validate this resubmission claim. |
Two older estimates have identifiable sources, but each measures a narrower population. The AMA's 2013 report card reported a 7.1% error rate on claims paid by the commercial insurers it examined. NerdWallet's 2014 analysis reported a 49% error rate in selected high-risk Medicare hospital claims audited by OIG, based on 34 hospital reviews released in 2013. NerdWallet explicitly warned against generalizing those audit results to all hospital claims. Both estimates are more than a decade old.
So how common are billing errors today? We did not find a current national estimate covering all medical bills in the sources reviewed. CMS's improper-payment rates in Table 10 and the denial reasons in Table 3 measure narrower, separately defined outcomes.
What is changing in medical billing in 2026?
On Kodiak’s platform, denial rates dipped, but insurer takebacks grew as a share of accounts receivable. That's the freshest signal, and it comes with a few others.
- Takebacks are up. On Kodiak's platform of more than 2,300 hospitals and 375,000 physicians, first-pass and final denial rates fell in the first half of 2026 compared with a year earlier. But the share of accounts receivable taken back after payment rose to 1.57%, from 1.38% (Kodiak Solutions, September 15, 2026). Accounts receivable is money owed to the provider.
- Billing companies still feel the squeeze. 46% of respondents in Tebra's December 2025 survey said denial rates rose over the past year, up from 28% a year before (Tebra).
- Electronic prior authorization is the unfinished job. In the 2025 CAQH Index, 63% of surveyed medical plans were still building prior authorization connections using the FHIR data standard, and only 20% of providers had started implementation (CAQH Index).
- AI is arriving unevenly. The 2025 CAQH Index reported that more than half of participating health plans and about a quarter of providers used AI for administrative work (CAQH Index). Among respondents in Experian's 2025 survey, 14% said they used AI to reduce denials (Experian Health). Among billing-company respondents, 59% said their firm hasn't adopted any (Tebra).
- New diagnosis codes took effect October 1, 2026. The fiscal 2027 update added 190 valid ICD-10-CM codes, deleted 30 and revised four code descriptions (CMS original files). Counting all distinct identifiers, including headers, gives 238 additions and 21 removals. Fifteen former valid codes remain as headers; the download explains the count.
- Federal payment-dispute volume kept growing. CMS counted 7,048,593 federal disputes initiated from April 15, 2022 through July 31, 2026. Providers, facilities and air-ambulance providers prevailed in about 85% of payment determinations in July–December 2025, down from 88% in January–June 2025 (CMS dispute reports; latest detailed outcomes).
- Change Healthcare reported about 192.7 million people affected. On July 31, 2025, the company reported that approximate breach total to the HHS Office for Civil Rights.
If you're weighing whether to outsource billing or switch billing companies, MedicalBillingSelect's provider examples show published fees, monthly minimums and contract terms side by side.
How we built this
We checked the original sources behind the figures on October 5, 2026, and wrote down the number, what it counts, the period, the source and any calculation. Those fields are in the download. The 86 rows are evidence records; some group closely related figures from the same source. They are not 86 separate studies.
Most figures come straight from the publisher's own page or files: CMS, the Bureau of Labor Statistics, the HHS Office of Inspector General, the Justice Department, KFF, CAQH, the American Medical Association, Premier, Kodiak, Experian, Tebra and the market-research firms. We read the original state filings and NAIC workbooks behind figures KFF quoted. KFF is the original source for its own analyses and polls.
We checked every displayed calculation. Eleven rows are MedicalBillingSelect calculations from published data, and the our_math column gives the inputs and formulas. We also show calculations used to check other source figures. We added, subtracted, divided and counted. We did not survey anyone or build a new national model.
For state denial rates, we added the claims and denials in the specified original filings before dividing. For CAQH’s 24.8%, we divided the same edition’s $18.7 billion medical savings estimate by its $75.3 billion measured medical spending. For job changes, we used BLS’s rounded employment levels and labeled its separately published growth rates. The diagnosis-code counts come from comparing the valid-code lists and addenda in CMS’s April 2026 and fiscal 2027 releases.
Where sources or methods differ, we show the difference. Premier’s displayed inputs produce $25.7535 billion, while its article reports $25.7 billion. CMS’s historical dispute series and older period reports differ by 230 initiations through June 2025; both give about 3.53 million. The download records those differences instead of treating the values as exact matches.
The site's methodology explains how MedicalBillingSelect labels sources in general.
What this data does and doesn't show
- It doesn't give one true denial rate. The fourteen measures count whole claims, service lines, prior authorization reviews or provider benchmarks. They cannot be ranked or averaged as one rate.
- Vendor figures cover specific samples. Kodiak's figures describe hospitals on its platform. Tebra's and Experian's describe the people who answered their surveys.
- Surveys report what people say. "41% of respondents said 10% or more of claims are denied" is not "41% of claims are denied."
- Market sizes are estimates. They differ in scope, method and forecast period. The public summaries do not provide everything needed to rebuild the publishers’ models.
- The job sum covers selected groups. It is not a count or a floor for the medical billing industry. The “other billing-clerk jobs” group includes self-employed workers.
- Improper-payment estimates do not measure fraud, and the five-program total adds separate federal estimates with different underlying payment windows.
- A reported benchmark is not a promise for one practice. CAQH’s savings are modeled opportunities before implementation costs. A hospital survey average is not a fee quote.
- Some things aren't established by the sources we reviewed: a current national error rate for all medical bills, one denial rate covering all employer plans, or audited profit figures for the whole billing-company industry.
How to cite this page
MedicalBillingSelect. "Medical Billing Industry Statistics: 86 Sourced Facts for 2026." Verified October 5, 2026. https://medicalbillingselect.com/research/medical-billing-industry-statistics/
To cite one figure, use its row ID from the download, for example: MedicalBillingSelect, "Medical Billing Industry Statistics," row C06, verified October 5, 2026. https://medicalbillingselect.com/research/medical-billing-industry-statistics/#stat-c06
Reuse: MedicalBillingSelect’s own calculations and original table and chart presentation may be reused with credit to MedicalBillingSelect. Keep the source names and notes with the figures, and follow the original sources’ terms. No link is required.
Download the data: medical-billing-industry-statistics.csv (86 rows) · medical-billing-calculations.csv (11 calculation rows) · denial-measures.csv · automation-opportunity.csv · electronic-share-by-workflow.csv · origin-check.csv. No sign-up.
Frequently asked questions
How big is the medical billing industry?
Estimates for the U.S. in 2026 run from $4.2 billion (IBISWorld, billing services including software and support) to $7.73 billion (Grand View Research, which also counts in-house billing). Two selected federal job groups related to billing and coding add up to about 378,800 jobs in 2025; that is not a count of the whole industry.
What is the average medical claim denial rate?
There isn't one average. Insurers on HealthCare.gov denied 19% of in-network claims in 2024. Kodiak reported an 11.6% average initial-denial measure and a 2.7% median final-denial measure for 2025, but its public annual charts do not establish those as shares of claim counts. Table 1 labels what each source measures.
Are medical billers in high demand?
Federal projections say yes. Medical records specialist jobs, the category that includes coders, are projected to grow 8% from 2025 to 2035, against 3% for all jobs. Using BLS’s rounded employment levels, billing-clerk payroll jobs grow by about 11,900 in health care and social assistance while all other billing-clerk jobs combined fall by 12,200. That second group includes self-employed workers.
Is AI replacing medical billers?
The projections do not isolate jobs lost to AI. The Bureau of Labor Statistics projects 8% growth for medical records specialists through 2035, while noting that AI coding tools may affect demand. In a December 2025 Tebra survey, 59% of billing-company respondents said their firm had not adopted any AI.
What is the global medical billing software market size?
Fortune Business Insights estimates it at $20.25 billion in 2025 and $22.34 billion in 2026, with North America at 40% in 2025. That is a global software estimate, so it can't be compared with U.S. billing-services figures.
How much does it cost to fight a denied claim?
$57.23 on average in 2023, up from $43.84 in 2022, according to a Premier survey of its member hospitals. That is the provider's administrative cost, not the value of the claim.
How often are denied claims appealed?
HealthCare.gov insurers reported at least 262,982 internal appeals in 2024, without a network split. In Medicare Advantage, reported appeal decisions equaled 11.5% of that year’s initial denials, and 80.7% of appeal decisions overturned the denial in full or in part. These annual totals do not track the same requests from initial denial to appeal.
Do 80% of medical bills have errors?
No current national estimate in the sources we reviewed establishes that. A traceable source is a bill-review service describing bills its clients sent in, not a sample of all U.S. medical bills.
Sources
- KFF, Claims Denials and Appeals in ACA Marketplace Plans in 2024 (March 24, 2026). Checked October 5, 2026.
- KFF, Medicare Advantage Insurers Made Nearly 53 Million Prior Authorization Determinations in 2024 (January 28, 2026). Checked October 5, 2026.
- HHS OIG, skilled-nursing prior authorization report OEI-09-24-00331 (June 11, 2026). Checked October 5, 2026.
- CMS, Fiscal Year 2025 Improper Payments Fact Sheet (January 15, 2026). Checked October 5, 2026.
- CMS, National Health Expenditure Accounts through 2024. Checked October 5, 2026.
- CMS, original national health expenditure tables. Checked October 5, 2026.
- BLS Occupational Outlook Handbook, Medical Records Specialists (August 27, 2026). Checked October 5, 2026.
- BLS Occupational Outlook Handbook, Financial Clerks (August 27, 2026). Checked October 5, 2026.
- BLS National Employment Matrix, billing and posting clerks, 2025–2035. Checked October 5, 2026.
- O*NET OnLine, billing and posting clerk wages from BLS. Checked October 5, 2026.
- U.S. Department of Justice, FY2025 False Claims Act release (January 16, 2026). Checked October 5, 2026.
- CAQH, 2025 Index Executive Report. Checked October 5, 2026.
- American Medical Association, 2025 prior authorization physician survey. Checked October 5, 2026.
- Premier, claims adjudication cost survey and original payer table (February 24, 2025). Checked October 5, 2026.
- CAQH, original 2019 Index, Table 3 and methods. Checked October 5, 2026.
- Kodiak Solutions, 2025 revenue losses release (March 31, 2026). Checked October 5, 2026.
- Kodiak Solutions, first-half 2026 denials and takebacks release (September 15, 2026). Checked October 5, 2026.
- Kodiak Solutions, State of the healthcare revenue cycle, original annual report (March 2026). Checked October 5, 2026.
- Kodiak Solutions, revenue-cycle measures and final-write-off definition (February 23, 2026). Checked October 5, 2026.
- Experian Health, 2025 State of Claims survey release (September 22, 2025). Checked October 5, 2026.
- Tebra, 2026 medical billing benchmark report. Checked October 5, 2026.
- IBISWorld, Medical Billing Services in the US. Checked October 5, 2026.
- Grand View Research, U.S. Medical Billing Outsourcing Market (January 2026). Checked October 5, 2026.
- Towards Healthcare, U.S. Medical Billing Outsourcing Market (August 18, 2026). Checked October 5, 2026.
- Dimension Market Research, original U.S. market release (November 19, 2024). Checked October 5, 2026.
- Fortune Business Insights, Medical Billing Software Market (updated September 21, 2026). Checked October 5, 2026.
- CMS, federal independent dispute resolution reports and bi-monthly tables. Checked October 5, 2026.
- CMS, fiscal 2027 ICD-10-CM code descriptions and addenda. Checked October 5, 2026.
- HHS Office for Civil Rights, Change Healthcare incident FAQ 11. Checked October 5, 2026.
- NerdWallet, original medical-debt study release (October 8, 2014). Checked October 5, 2026.
- NerdWallet, original 2014 report and high-risk claim sample limits. Checked October 5, 2026.
- Family Business Magazine, Health Insurance (December 1, 1990). Checked October 5, 2026.
- ABC News, Hidden Costs in Hospital Bills (April 2001). Checked October 5, 2026.
- In Ovations Holdings release (November 23, 2015), syndicated on ADVFN. Checked October 5, 2026.
- Family Practice Management, The Cure for Claims Denials (March 2015). Checked October 5, 2026.
- AMA president’s original commentary on the 2013 report card (September 15, 2013). Checked October 5, 2026.
- Tina Graham, author-byline republication of MGMA denial-management article. Checked October 5, 2026.
- PubMed, bibliographic record for Tina Graham’s February 2014 MGMA article. Checked October 5, 2026.
- CMS, Transparency in Coverage PY2026 data dictionary, reflecting 2024 data. Checked October 5, 2026.
- CMS, CY2024 Part C reporting specifications. Checked October 5, 2026.
- CMS, 2025 Medicaid and CHIP supplemental federal improper-payment tables. Checked October 5, 2026.
- CMS, quick definitions for national health expenditure categories. Checked October 5, 2026.
- NAIC, 2025 national health ratios workbook. Checked October 5, 2026.
- NAIC, 2024 national health ratios workbook. Checked October 5, 2026.
- NAIC, 2025 Health MCAS reporting definitions. Checked October 5, 2026.
- Covered California, original issuer denied-claim filings. Checked October 5, 2026.
- Connecticut Insurance Department, 2025 Consumer Report Card, 2024 claims. Checked October 5, 2026.
- Vermont Department of Financial Regulation, original Act 152 insurer filings. Checked October 5, 2026.
- HHS OIG, Medicaid managed-care prior authorization report, 2019 sample. Checked October 5, 2026.
- CMS, prior authorization program statistics, fiscal 2024. Checked October 5, 2026.
- KFF, January 2026 health tracking poll original topline. Checked October 5, 2026.
- KFF, original marketplace-denial analysis working file. Checked October 5, 2026.
- CMS, federal IDR outcomes, July–December 2025. Checked October 5, 2026.
- CMS, federal IDR outcomes, January–June 2025. Checked October 5, 2026.
- Tebra, original benchmark report PDF. Checked October 5, 2026.
- AMA, original prior authorization survey questions. Checked October 5, 2026.
- CMS, April 1, 2026 ICD-10-CM comparison files. Checked October 5, 2026.
- U.S. Department of Justice, original FY2025 statistics sheet. Checked October 5, 2026.
MedicalBillingSelect Research is the research and reference section of medicalbillingselect.com.