Claim Denial Rate Benchmark: 7%–8% for Practices, Plus a Calculator
By MedicalBillingSelect · Updated October 2026
The claim denial rate benchmark for practices is 7% to 8% of claims denied on first submission, according to MGMA's July 2026 summary. Below 5% is within reach, MGMA says. The reporting insurers' counts run higher: 138 of 157 reporting HealthCare.gov insurers denied 10% or more of in-network claims in 2024, according to MedicalBillingSelect's October 2026 analysis of CMS data.
Why the gap? Those two numbers answer different questions. Three things move a denial rate: who counted, when they counted, and what they counted. The table below lines up every dated benchmark we could trace, so you can hold your number next to the right one.
Key claim denial rate statistics
- 7% to 8% of medical practice claims were denied on first submission across the past four years, per MGMA benchmarking (MGMA, July 30, 2026).
- Below 5% is a first-submission denial rate practices can reach with targeted process fixes, according to MGMA's reading of its 2025 Financials and Operations data (MGMA, July 30, 2026).
- 138 of 157 reporting HealthCare.gov insurers (88%) denied 10% or more of in-network claims in 2024, and they handled 95% of those claims (MedicalBillingSelect analysis of CMS Transparency in Coverage data, October 2026).
- 18.7% of in-network claims sent to the 157 reporting HealthCare.gov insurers in 2024 ended up denied: 84.5 million of 451.2 million (MedicalBillingSelect analysis of CMS data, October 2026; KFF reports the same figure as 19%).
- 4 of 157 reporting HealthCare.gov insurers denied fewer than 5% of in-network claims in 2024 (MedicalBillingSelect analysis of CMS data, October 2026).
- 6.5% to 27.0%: in-network denial rates for the reporting HealthCare.gov insurers ran from South Dakota's 6.5% to Hawaii's 27.0% in 2024, a 4.1-fold gap across the 30 states in the file (MedicalBillingSelect analysis of CMS data, October 2026).
- 12% was the average denial rate in Optum's hospital sample in 2023, up from 10% in 2020 and 9% in 2016, across about 124 million claim remits (Optum 2024 Revenue Cycle Denials Index).
- 2.7% was Kodiak's reported median final denial rate for its provider sample in 2025, up from 2.5% in 2024; its public report does not say what total it divides by (Kodiak Solutions, March 2026).
- 7.8%, 10.5% and 15.1%: initial denial rates for professional services at commercial, Medicare Advantage and Medicaid managed care plans in 2019, weighted by Medicare prices (Weinreb and Landon, Health Affairs Scholar, August 2026).
- 68.6% of hospital claims that were denied at first were paid in the end in 2023, after an average of three rounds of review (Premier survey of 280 hospitals, February 2025).
- $57.23 was the average cost for a hospital to fight one denied claim in 2023, up from $43.84 in 2022 (Premier survey of 280 hospitals, February 2025).
- 41% of respondents to Experian's 2025 provider survey said 10% or more of their claims are denied, up from 30% in 2022 (Experian Health State of Claims survey, 250 people in the full survey; the chart does not give a question-specific count).
- 84% of hospital claim denials in Optum's 2023 sample were potentially avoidable (Optum 2024 Revenue Cycle Denials Index).
- 5% to 10% is the "industry average" published on an AAFP practice-finance page that measures dollars and gives no dataset, sample or year (checked October 2026).
On this page: Benchmarks by source · Calculator · Good rate · The 5%–10% rule · Insurers · States · Payers · Trends · Paid in the end · Cost · Billing companies · Method · Data · FAQ
Which claim denial rate benchmark fits your claims?
A medical practice should start with 7% to 8%, MGMA's figure for claims denied on first submission. Optum's hospital sample averaged 12% in 2023. The insurer figures here run from 8.5% to 21% and cover different populations, years and counting rules.
Read across each row before you compare. A number only fits your report if the middle four columns match how you counted.
| Whose claims | Rate | Who counted | First "no" or final | Counts | Data period | Source |
|---|---|---|---|---|---|---|
| Medical practices | 7% to 8% | Practices, in MGMA benchmarking | First submission | Claims | Past four years, as of July 2026 | MGMA |
| Medical practices (reachable goal) | Below 5% | MGMA | First submission | Claims | 2025 data report | MGMA |
| Rule of thumb | 5% to 10% | No dataset given | Not stated | Dollars | No year given | AAFP |
| Hospitals | 12% | Hospitals' remits, via Optum | Not stated | Claim remits | 2023 | Optum |
| Hospitals and physician groups | 11.81% | Providers on Kodiak's platform | First response | Claims, per release; full rules not given | 2024 | Kodiak |
| Kodiak provider sample | 2.7% (median) | Providers on Kodiak's platform | Final | Denominator not stated | 2025 | Kodiak |
| Hospitals (survey) | Nearly 15% | 280 hospitals, self-reported | First response | Claims | 2023 | Premier |
| Professional services, by payer | 7.8% commercial; 10.5% Medicare Advantage; 15.1% Medicaid managed care | Researchers, from health plans' claims data | Any submission denied | Claim value at Medicare prices | 2019 | Weinreb and Landon |
| HealthCare.gov insurers, in-network | 18.7% | Insurers, reported to CMS | Final | Claims, medical and drug combined | 2024 | CMS data, our calculation |
| Insurers filing with state regulators | 15.5% | Insurers, pooled national ratio | Not stated | Claims, no pharmacy; networks combined | 2025 | NAIC |
| Insurers filing with state regulators (earlier year) | 16% | Insurers, pooled national ratio | Not stated | Claims, no pharmacy; networks combined | 2024 | NAIC |
| Insurers in Connecticut's HMO and indemnity tables | 14% | Insurers | Not stated | Claims; networks combined | 2024 | Connecticut Insurance Department |
| Vermont state-regulated insurers | 8.5% | Three insurer returns | Not stated | Medical, mental-health and drug claims | 2025 | Vermont DFR, our calculation |
| Vermont state-regulated insurers (earlier year) | 8.5% | Three insurer returns | Not stated | Medical, mental-health and drug claims | 2024 | Vermont DFR, our calculation |
| Covered California, eight usable individual-market issuer returns, in-network | 21% | Insurers | Not stated | Claim lines: each service line on a bill | 2023 | Covered California, our calculation |
NAIC's ratios are published totals, not our calculation from raw counts. Its dashboard notes New York's inclusion as of September 8, 2026; we do not treat the two years as a fixed-sample trend. The NAIC and individual states do not endorse any calculation or subsequent use of the MCAS scorecard data.
Two rows look far apart: 7% to 8% and 18.7%. They are not fighting each other. One is a practice counting its first "no." The other is an insurer counting every claim that stayed denied, drug claims included.
How do you calculate your claim denial rate?
Divide the claims denied on the payer's first decision by all the claims in that same batch, then multiply by 100. If 80 of 1,000 claims come back denied, your rate is 8.0%. That is the top of MGMA's published 7% to 8% range for practices. MGMA's public summary does not give every counting rule, so use it as context.
Use the calculator to run your own numbers. It keeps each way of counting apart, so you never compare a dollar rate to a claim-count benchmark by accident.
Calculator
Claim denial rate calculator
Pick the counting method first. Each method has its own definition, and the units change with it. Results are arithmetic on your totals, not a score.
Enter your totals and choose Calculate. The result, formula and a plain sentence will appear here.
Use totals only. Don't enter patient details. This calculator runs in your browser. Your entries are not saved or sent.
What goes in, and what stays out?
Use one batch of original claims and count each claim once. A claim with three denied lines is still one denied claim. Leave out rejections, which are claims that bounced before the payer made any decision.
| Measure | Top number | Bottom number | Source |
|---|---|---|---|
| First-submission rate (claims) | Claims denied on the first decision | Claims in the same batch | MedicalBillingSelect arithmetic; MGMA reports a first-submission reference without all counting rules |
| Denial rate (dollars) | Dollars on claims denied in the period | Dollars on claims submitted in the same period | AAFP |
| HFMA initial denial rate | Claims with a first denial this month | Average monthly claims submitted in the prior three months | HFMA task force |
| HFMA remittance denial rate (AR-5) | Claim-level remittance entries with actionable denials this month | All claim-level remittance entries this month | HFMA MAP Keys |
| HFMA denial write-offs (AR-6) | Net dollars written off as denials | Average monthly net patient service revenue, reporting month and two prior months | HFMA MAP Keys |
What is a good claim denial rate?
Below 5% is the mark to aim for. MGMA says practices can push first-submission denials below 5% with targeted process fixes, against a typical 7% to 8%. AAFP also calls below 5% more desirable for its dollar-based rate.
A goal and an average are different animals. The average describes reported performance. The goal gives you a mark to aim for.
Say you send 1,000 claims a month. At 8%, 80 come back. At 5%, 50 do. That is 30 fewer claims for someone to chase every month.
If you are sizing up outside help, our questions to ask for your practice cover who follows up on denials and who doesn't.
Where does the "5% to 10%" benchmark come from?
AAFP publishes the 5% to 10% range on its page about practice finances. The page calls 5% to 10% the industry average and below 5% more desirable. It measures dollars, and it gives no dataset, sample or year.
Other groups often get the credit. HFMA's denial-metrics report gives formulas and sets no target number at all.
MGMA's 7% to 8% sits inside the old rule as a number. But one counts claims and the other counts dollars. That overlap does not make them the same benchmark. The trouble starts when the rule gets pasted onto a different measure.
Why can't you compare a dollar rate to a claim rate?
Because one big claim can swing the dollar rate. Here is a made-up example. You send ten claims: nine for $100 and one for $1,000. The $1,000 claim is denied.
- By claims: 1 ÷ 10 = 10%.
- By dollars: $1,000 ÷ $1,900 = 52.6%.
Same ten claims. Same single denial. Two very different answers.
| Question | Why the number moves |
|---|---|
| Who counted? | A practice counts its own claims. The CMS insurer measure includes medical and drug claims and duplicate-claim denials; other sources use different rules. |
| When? | A first "no" can be more common than a "no" that sticks. In the 2019 study below, professional services billed to commercial plans had a 7.8% initial rate and a 4.2% final rate, both weighted by Medicare prices. |
| What? | Counting claims and counting dollars give different rates, as the example above shows. |
How many insurers deny 10% or more of claims?
In the CMS file, 138 of 157 reporting HealthCare.gov insurers denied 10% or more of in-network claims in 2024. Those 138 insurers handled 95% of the file's in-network claims. The median insurer denied 19.0%, and only 4 insurers came in under 5%.
Put another way: of every 20 in-network claims in this file, about 19 went to an insurer that turned down at least 1 in 10.
Here, one insurer means one state-specific issuer ID in CMS's Health Insurance Oversight System (HIOS). The same parent company can have more than one ID.
| In-network denial rate | Insurers | In-network claims | Share of claims |
|---|---|---|---|
| Under 5% | 4 | 2,343,994 | 0.5% |
| 5% to under 10% | 15 | 20,912,766 | 4.6% |
| 10% to under 15% | 17 | 21,983,880 | 4.9% |
| 15% to under 20% | 53 | 276,875,670 | 61.4% |
| 20% to under 25% | 44 | 113,363,219 | 25.1% |
| 25% to under 30% | 20 | 15,531,617 | 3.4% |
| 30% or more | 4 | 238,344 | 0.1% |
| All insurers | 157 | 451,249,490 | 100% |
Source: CMS Transparency in Coverage Public Use File (PY2026 file; 2024 claims). Analysis: MedicalBillingSelect, October 2026.
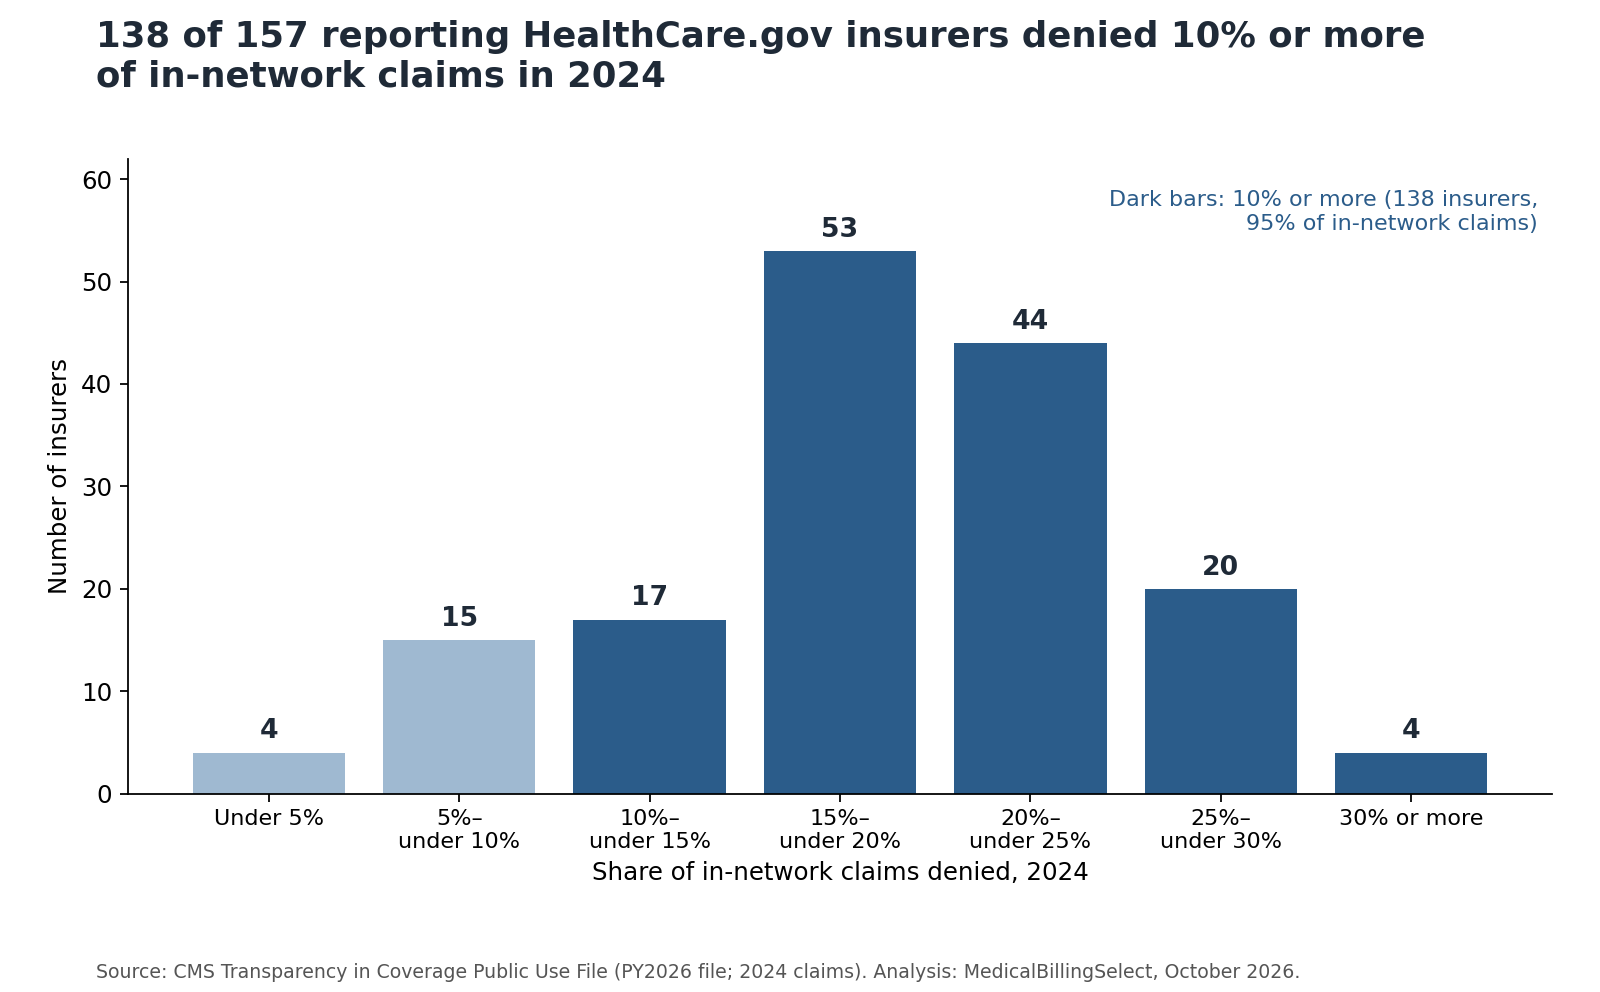
The four insurers under 5% were Avera Health Plans in South Dakota (2.7%), Providence Health Plan in Oregon (4.0%), and Sanford Health Plan in South Dakota (4.1%) and North Dakota (4.4%).
A fair warning about this yardstick. These are insurers' counts, not a practice's. They cover medical and drug claims together. And a claim that was denied, fixed, resent and paid does not stay in the denied count. CMS tells insurers to count denials at final adjudication, when the claim's outcome is settled. So 18.7% is a final-adjudication rate, not a first-pass one.
What is the claim denial rate by state?
Across the 30 states represented in this file, in-network denial rates in 2024 ran from 6.5% in South Dakota to 27.0% in Hawaii. That is a 4.1-fold gap: out of the same number of claims, Hawaii insurers denied about 4 for every 1 denied in South Dakota. In 28 of the 30 states, the rate was 10% or higher.
These figures cover reporting marketplace insurers only. They do not cover every insurer or state that used HealthCare.gov during 2024. California and New York are not in this federal file.
| Rank | State | Insurers | In-network claims | Denied | Denial rate | Lowest insurer | Highest insurer |
|---|---|---|---|---|---|---|---|
| 1 | South Dakota | 3 | 1,716,452 | 112,411 | 6.5% | 2.7% | 15.4% |
| 2 | North Dakota | 3 | 1,432,238 | 140,595 | 9.8% | 4.4% | 20.9% |
| 3 | New Hampshire | 3 | 3,077,141 | 321,334 | 10.4% | 7.0% | 28.8% |
| 4 | Oregon | 6 | 2,552,164 | 277,498 | 10.9% | 4.0% | 17.4% |
| 5 | Montana | 2 | 2,012,739 | 234,099 | 11.6% | 10.5% | 12.5% |
| 6 | Wisconsin | 12 | 9,824,576 | 1,188,325 | 12.1% | 6.5% | 18.9% |
| 7 | Indiana | 3 | 6,461,283 | 980,842 | 15.2% | 10.5% | 19.6% |
| 8 | Missouri | 8 | 12,197,986 | 1,900,841 | 15.6% | 7.5% | 24.5% |
| 9 | Arkansas | 6 | 17,922,408 | 2,848,075 | 15.9% | 15.4% | 16.5% |
| 10 | South Carolina | 5 | 21,454,469 | 3,656,371 | 17.0% | 15.5% | 32.7% |
| 11 | Michigan | 7 | 13,652,457 | 2,371,866 | 17.4% | 7.9% | 27.7% |
| 12 | Wyoming | 1 | 1,305,051 | 229,909 | 17.6% | 17.6% | 17.6% |
| 13 | Ohio | 10 | 16,409,625 | 2,934,307 | 17.9% | 8.3% | 26.5% |
| 14 | Kansas | 6 | 6,298,697 | 1,148,305 | 18.2% | 12.9% | 26.1% |
| 15 | Oklahoma | 7 | 11,625,740 | 2,122,396 | 18.3% | 8.5% | 26.0% |
| 16 | Mississippi | 4 | 14,872,712 | 2,725,739 | 18.3% | 16.0% | 27.7% |
| 17 | Texas | 14 | 120,606,438 | 22,372,063 | 18.5% | 11.7% | 35.7% |
| 18 | Louisiana | 5 | 9,356,149 | 1,738,366 | 18.6% | 14.6% | 24.1% |
| 19 | Utah | 5 | 9,574,435 | 1,781,829 | 18.6% | 14.8% | 22.9% |
| 20 | Iowa | 3 | 4,833,668 | 911,035 | 18.8% | 17.8% | 25.1% |
| 21 | Alabama | 3 | 18,358,599 | 3,464,098 | 18.9% | 17.9% | 21.4% |
| 22 | Nebraska | 3 | 1,959,261 | 383,930 | 19.6% | 15.6% | 21.7% |
| 23 | Delaware | 3 | 2,232,506 | 440,631 | 19.7% | 19.0% | 28.2% |
| 24 | North Carolina | 7 | 23,717,695 | 4,713,568 | 19.9% | 16.1% | 28.3% |
| 25 | Arizona | 6 | 7,874,919 | 1,581,162 | 20.1% | 15.3% | 33.1% |
| 26 | Tennessee | 5 | 22,656,628 | 4,559,085 | 20.1% | 18.9% | 23.5% |
| 27 | West Virginia | 2 | 3,184,929 | 669,877 | 21.0% | 20.1% | 23.6% |
| 28 | Florida | 11 | 82,397,280 | 18,256,139 | 22.2% | 6.5% | 27.3% |
| 29 | Alaska | 2 | 946,098 | 239,313 | 25.3% | 17.3% | 27.0% |
| 30 | Hawaii | 2 | 735,147 | 198,653 | 27.0% | 5.1% | 27.4% |
| All 30 states | 157 | 451,249,490 | 84,502,662 | 18.7% |
Source: CMS Transparency in Coverage Public Use File (PY2026 file; 2024 claims). Analysis: MedicalBillingSelect, October 2026.
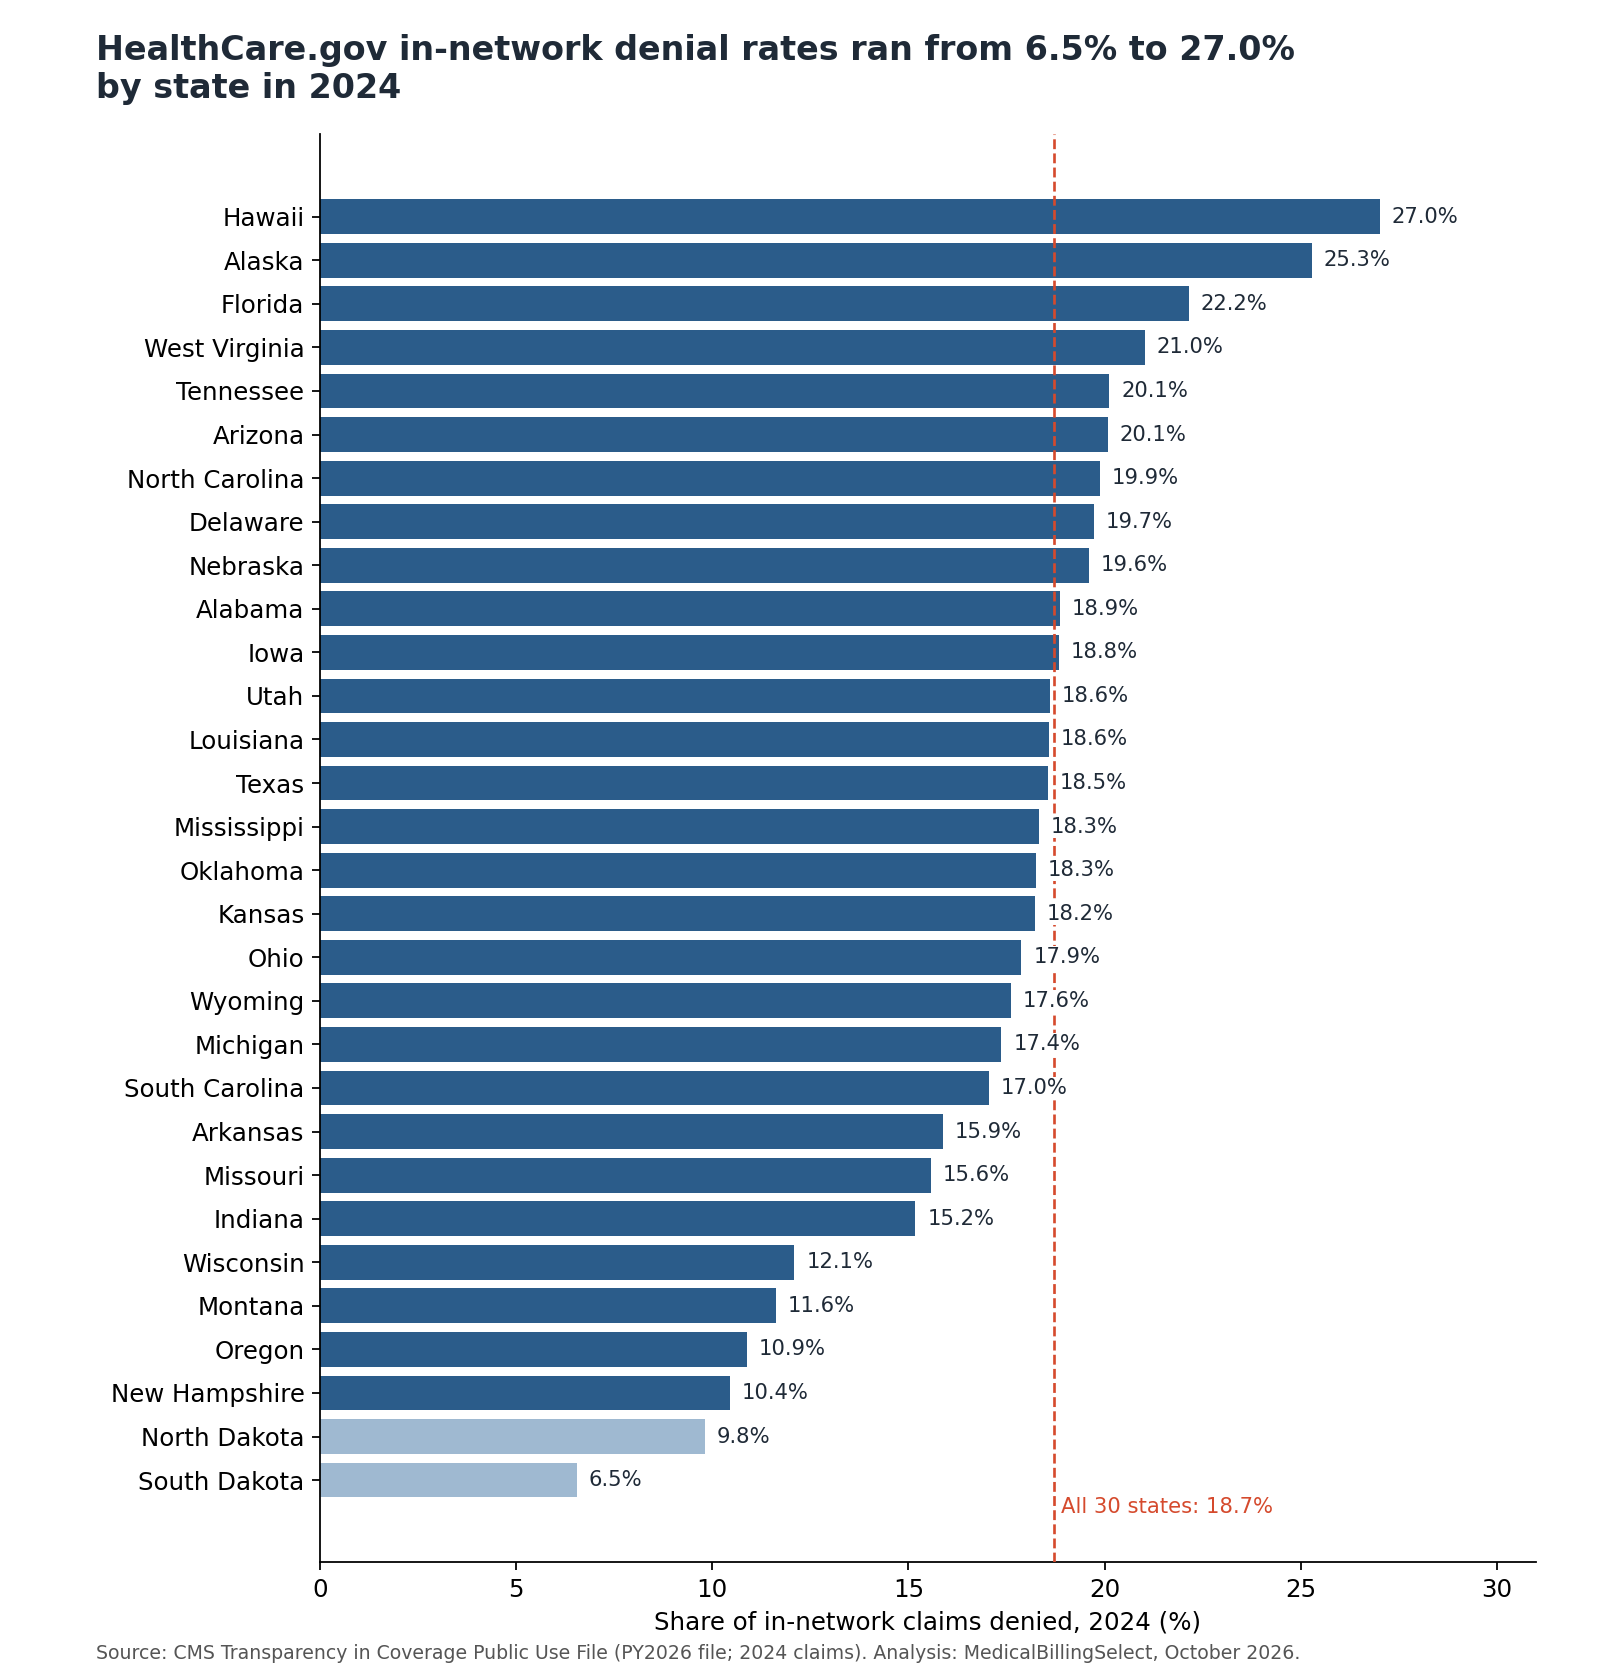
Two things hide inside a state average.
First, insurers in one state can be far apart. Texas had 14 insurers. Their rates ran from 11.7% to 35.7%.
Second, two states account for almost half of the sample's claims. Texas and Florida together held 45% of all in-network claims in the file.
How do denial rates differ by payer?
For professional services in 2019, Medicaid managed care plans had an initial denial rate of 15.1%, Medicare Advantage plans 10.5% and commercial plans 7.8%, in a study of 234.2 million claims. After resubmissions, the final rates were 7.4%, 4.1% and 4.2%. These rates are weighted by Medicare prices, so they are not simple claim counts.
That makes Medicaid managed care's initial rate about 1.9 times the commercial rate, a gap of 7.3 points (our math from the study's figures).
| Setting | Payer | Initial | Final | Share of denied value later paid |
|---|---|---|---|---|
| Physician and other professional services | Commercial | 7.8% | 4.2% | 46.4% |
| Physician and other professional services | Medicare Advantage | 10.5% | 4.1% | 60.8% |
| Physician and other professional services | Medicaid managed care | 15.1% | 7.4% | 51.1% |
| Hospital inpatient | Commercial | 14.9% | 4.1% | 72.8% |
| Hospital inpatient | Medicare Advantage | 20.0% | 8.3% | 58.5% |
| Hospital inpatient | Medicaid managed care | 14.4% | 5.0% | 65.1% |
| Hospital outpatient | Commercial | 12.6% | 5.9% | 52.8% |
| Hospital outpatient | Medicare Advantage | 16.5% | 6.0% | 63.6% |
| Hospital outpatient | Medicaid managed care | 12.7% | 6.5% | 48.7% |
Source: Weinreb & Landon, Health Affairs Scholar (2026), Figure 1; 2019 claims; CC BY 4.0. Chart: MedicalBillingSelect, October 2026.
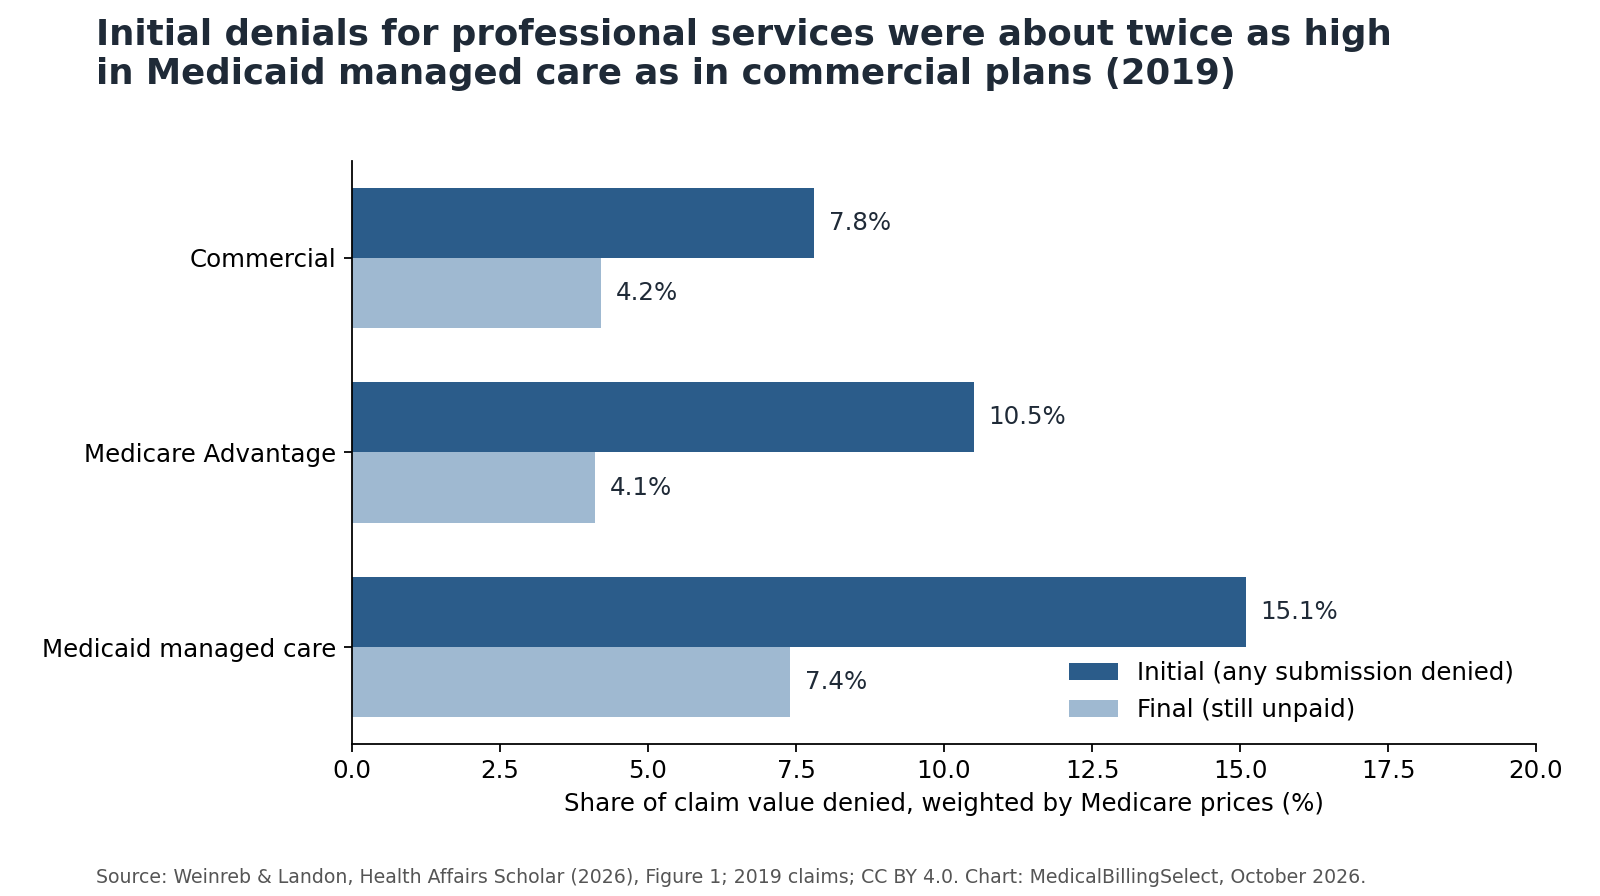
Three things to keep straight when you quote this table:
- "Initial" here means any submission of the claim was marked denied. It is not a strict first-pass count.
- The data is from 2019. The study came out in 2026.
- There is no traditional Medicare row. The authors could not see those denials. A separate Premier survey of 2022 hospital claims reported 8.4% for traditional Medicare, 13.9% for commercial plans and 15.7% for Medicare Advantage.
The same study found a gap by type of provider. For professional services, safety-net providers had an initial rate of 13.6%. Other providers had 9.2%, with both rates weighted by Medicare prices. Here, safety-net means the top fifth by share of Medicare claims for people covered by both Medicare and Medicaid, among providers with at least 20 Medicare claims. The comparison combines the study's three payer groups in their observed mix.
A separate study of 2019 Medicare Advantage claims found that 17.7% of first submissions were denied and 40.8% of those denials were later overturned. When weighted by claim value at Medicare prices, the figures were 16.6% and 56.6% (Vabson, Hicks and Chernew, Health Affairs, June 2025). "Most were reversed" describes the value-weighted result, not the claim count.
Are claim denial rates going up?
Optum's hospital average rose from 9% in 2016 to 12% in 2023, a 3-point climb in seven years. For medical practices, MGMA's first-submission figure has held at 7% to 8% for four years.
| Source and measure | Earlier | Later |
|---|---|---|
| Optum, hospital average denial rate | 9% (2016); 10% (2020) | 12% (2023) |
| Kodiak, initial denial rate, 2025 releases | 10.2% (2020); 11.53% (2023) | 11.81% (2024) |
| Kodiak, initial denial rate, March 2026 report | 11.4% (2024) | 11.6% (2025) |
| Kodiak, median final denial rate | 2.5% (2024) | 2.7% (2025) |
| MGMA, practices, first submission | 8% in the 2023 DataDive edition; same rate documented in 2019 | 7% to 8% (past four years, as of July 2026) |
| Experian, share of respondents reporting 10% or higher | 30% (2022); 38% (2024) | 41% (2025) |
Never draw one line through two sources. Kodiak itself shows why. Its 2025 release put 2024 at 11.81%. Its 2026 report puts the same year at 11.4%. The sources do not explain that restatement. Keep the two release series apart.
And read the Experian row with care. It says more people report high denial rates: 11 points more between 2022 and 2025. It does not say the denial rate rose 11 points.
Why does the benchmark matter right now?
Because the first "no" is no longer the whole story. In the first half of 2026, Kodiak says initial and final denial rates both fell, yet insurers took back 1.57% of accounts receivable after paying, up from 1.38% a year earlier (Kodiak, September 15, 2026). A falling denial rate can sit next to falling cash.
Practices feel it. In MGMA's January 6, 2026 poll, 48% of the 288 responding medical group leaders named denials and appeals as their biggest source of lost revenue (MGMA's original poll report).
More public data is on the way, too. CMS's 2027 certification rules add separate behavioral-health claim counts and information on requests made before care, such as prior authorizations. They also add reasons for out-of-network denials.
How many denied claims get paid in the end?
Hospitals told Premier that 68.6% of claims denied at first in 2023 were paid in the end. In the 2019 study above, between 46% and 73% of initially denied claim value was later paid, depending on payer and setting. Those study rates are weighted by Medicare prices.
Getting there is slow. Premier's hospitals went through three rounds of review on average, and each round took 45 to 60 days.
That is why an initial denial does not always become a lasting loss. In the 2019 study, professional services billed to commercial plans had a 7.8% initial rate and a 4.2% final rate, both weighted by Medicare prices.
Patients are a different story. HealthCare.gov insurers reported at least 262,982 completed internal appeals in 2024. Among the 135 issuer-state records with both appeal counts visible, 66.4% were not overturned (MedicalBillingSelect analysis of CMS data). The appeals data are not split by network. A patient's appeal and a biller's corrected claim are two separate paths.
What does a denied claim cost?
Hospitals spent $57.23 on average to fight one denied claim in 2023, up from $43.84 in 2022, according to Premier's survey of 280 hospitals. Premier says added labor drove most of the increase. No comparable figure for small practices turned up in the sources we checked.
So treat this as a what-if. Say rework cost your office what it cost those hospitals.
- At 8%, 1,000 claims means 80 denials: 80 × $57.23 = $4,578.40.
- At 5%, it means 50 denials: 50 × $57.23 = $2,861.50.
- Each point of denial rate is 10 claims per 1,000, or $572.30.
Your own cost is the number that matters. The calculator has a blank for it.
Rework is one cost of billing. The fee is another. See how a monthly minimum changes what a billing percentage really costs.
What should you ask a billing company about its denial rate?
Ask how the number was counted before you ask how low it is. A "3% denial rate" could count first denials, claims still denied after follow-up, or dollars lost. A 3% first-pass claim rate would sit below MGMA's 7% to 8% practice reference. It cannot be compared with a hospital's dollar-based final rate. Those are very different claims about the same service.
Four questions sort it out:
- Is that a first-pass rate or a final rate?
- Does it count claims or dollars?
- Which claims are in the bottom number? All payers, or a chosen few?
- Do rejections, partial denials and repeat denials count?
Then ask for the same number for practices like yours, over the same months. We hold provider claims to the same test; see how we assess performance claims.
If you're weighing outside billing help, start with our published billing company examples, then ask each company to define the denial rate it quotes.
How did we build this?
We checked each benchmark against its original source, and we calculated the insurer and state figures ourselves from 451.2 million in-network claims that 157 insurers reported to CMS for 2024. We rechecked the cited sources on October 6, 2026. We did not survey anyone or collect any patient records.
The insurer and state numbers. Insurers that sell plans on HealthCare.gov report claim counts to CMS each year. CMS publishes them in its Transparency in Coverage Public Use File. The newest file, labeled plan year 2026, holds 2024 claims. We downloaded the official workbook from CMS on October 6, 2026. Its individual-plan sheet has 4,159 plan rows. We converted four counts stored as text to numbers. Because issuer counts repeat across plans, we checked that those counts agreed, then kept one row for each of 185 state-and-issuer-ID pairs.
We kept records with more than 1,000 in-network claims received and a numeric denied count between zero and the received count. We excluded 26 records with unavailable counts and two small-count records. That left 157 reporting issuer-state records in 30 states. Our totals match KFF's working file and published totals: 451.2 million in-network claims and 84.5 million denials.
For each insurer, we divided in-network claims denied by in-network claims received. For each state, we added up its insurers' claims first and then divided. We did not round before counting insurers above or below a line. That puts 19 insurers below 10%. Rounding each rate to a whole percent first would put 17 below 10%, the count in KFF's article. KFF does not state that rounding rule in its visible method.
The other benchmarks. We read the MGMA, AAFP, HFMA, Optum, Premier, Experian, Kodiak and both journal articles directly, including charts that hold figures missing from the page text. We checked the NAIC workbooks, Connecticut report card, Vermont insurer filings and Covered California issuer filings at their original sources. We transcribed published rates and kept each source's units and period.
Premier's 2025 report uses a survey of 280 hospitals in 23 states, collected from August 8, 2024, to February 4, 2025, about 2023 claims. It weights results by acute-care bed capacity. Its separate 2024 report surveyed 516 hospitals in 36 states from October through December 2023 about 2022 claims, also weighted by beds. These are two survey rounds, not a fixed group followed over time.
For Connecticut, Vermont and Covered California, the regulator input file below shows each included source row and the sums behind our checks. For consumer appeals, we kept suppressed cells as unknown. We summed visible completed-appeal counts for the reported minimum, then used only the 135 records with both counts visible for the share not overturned: (255,373 − 85,807) ÷ 255,373 × 100 = 66.4%.
To reproduce it. Download the insurer file below. Divide column five by column four, then multiply by 100. Sort and count using the unrounded result. For a state rate, sum its denied and received counts before dividing. To start from CMS, use the "Transparency 2026 - Ind QHP" sheet and the filters above; do not add the issuer totals repeated on each plan row. The benchmark and regulator files preserve the other sources and calculations.
What does this data show, and what doesn't it?
It shows how often claims are denied under each source's own rules, from 7% to 8% for practices on first submission to 18.7% for HealthCare.gov insurers. It does not give one true national average, and nobody should build one by blending these rows.
A few more limits, plainly:
- The HealthCare.gov analysis covers the reporting marketplace insurers in 30 states in this file. It says nothing about employer plans, traditional Medicare or most Medicaid, and is not a census of all 2024 marketplace insurers.
- The CMS insurer counts include drug claims and claims filed by or for patients. Other sources differ: NAIC, for example, excludes pharmacy.
- A denial rate does not tell you whether the denials were right or wrong.
- MGMA's public summary does not give its sample size or exact years.
- Kodiak and Optum data come from their own customers. Premier and Experian are surveys of what people report.
- The payer table uses 2019 claims, weighted by Medicare prices. Professional services include physicians and allied health professionals. Its published overturn rates use the underlying data; do not recalculate them from the rounded initial and final rates.
- One odd spot: Alaska's records show 87,953 out-of-network claims denied but only 77,110 received. We do not guess a fix. The in-network counts used here are internally consistent.
- CMS says these insurer counts are self-reported and does not guarantee every field's accuracy. The original calculations on this page are MedicalBillingSelect's, not CMS findings.
Nothing here is billing, coding or legal advice.
How do you cite this page?
Cite the table or statistic you used, and keep the data year in your sentence. Our own work is the insurer and state analysis and the side-by-side source table. The original publishers keep the credit for their figures.
MedicalBillingSelect. "Claim Denial Rate Benchmark: 7%–8% for Practices, Plus a Calculator." Updated October 2026. https://medicalbillingselect.com/research/claim-denial-rate-benchmark/
You may reuse MedicalBillingSelect's original table and chart designs and calculations with credit to MedicalBillingSelect; this permission does not require a link. Underlying figures remain credited to their original publishers, and their source terms still apply. This permission does not relicense third-party reports, graphics or data.
Where can you download the data?
All six files are free CSVs with a source and a check date on every row. No form, no email. They hold published totals and our calculations, never patient-level claims.
- claim-denial-rate-benchmarks.csv: every benchmark in Tables 1 and 7, plus cost, survey and appeal figures; 36 rows.
- healthcare-gov-insurer-denial-rates-2024.csv: 157 reporting issuer-state records.
- healthcare-gov-state-denial-rates-2024.csv: the 30 states in the CMS sample.
- denial-rates-by-payer-and-setting-2019.csv: Table 6, plus the study's safety-net rows; 15 rows.
- regulator-denial-rate-inputs.csv: 32 source rows behind the Connecticut, Vermont, California and NAIC checks, including exclusions.
- healthcare-gov-consumer-appeals-2024.csv: 157 reporting issuer-state records, with suppressed appeal counts kept as unknown.
Frequently asked questions
What is the average claim denial rate for a medical practice?
About 7% to 8% of claims are denied on first submission, per MGMA's July 2026 summary of four years of practice benchmarking. MGMA's public summary does not give the sample size, so treat it as the best public reference for practices, not a census.
What is a good claim denial rate?
Below 5%. MGMA says practices can get first-submission denials under 5% with targeted fixes, and AAFP calls below 5% more desirable for its dollar-based rate.
How do you calculate a claim denial rate?
Divide claims denied on the first decision by all claims in the same batch, then multiply by 100. Eighty denied out of 1,000 is 8.0%. If your report counts dollars or remittances, use that method in the calculator instead.
What is the difference between an initial and a final denial rate?
An initial rate counts an early "no" under the source's rules. A final rate counts claims that stay denied after follow-up. In the 2019 payer study, professional services billed to commercial plans had a 7.8% initial rate and a 4.2% final rate, both weighted by Medicare prices; its initial measure includes any denied submission.
Is the 5% to 10% benchmark accurate?
AAFP gives 5% to 10% as guidance for a dollar-based measure and cites no dataset or year. MGMA's 7% to 8% practice figure counts first-submission claims. The numbers overlap, but the measures do not match. Optum's hospital sample averaged 12% in 2023; insurer-source figures here range from 8.5% to 21% under different rules.
Is a denial the same as a rejection?
No. A rejection sends a claim back before a payment decision, such as for missing or invalid data. A denial comes after the payer has processed the claim. CMS distinguishes unprocessable returns from denials. Track them separately.
Which state has the highest claim denial rate?
Among the 30 states represented in this CMS file, Hawaii was highest at 27.0% of in-network claims and South Dakota was lowest at 6.5% in 2024. These figures cover reporting marketplace insurers only.
Does an 8% denial rate mean losing 8% of revenue?
No. Many denied claims are paid after they are fixed and resent, and claims differ in size. Hospitals told Premier that 68.6% of initially denied claims were paid in the end in 2023.
Sources
MGMA. "Days in A/R holds steady for most practices, but payer pressure persists in 2026." July 30, 2026. Source — checked October 6, 2026.
MGMA. "Strategic improvements in your RCM to reduce your practice's claim denials." March 6, 2024. Source — checked October 6, 2026.
AAFP. "Managing practice finances," denial-rate formula and guidance. Source — checked October 6, 2026.
HFMA. "Standardizing denial metrics for revenue cycle benchmarking and process improvement" (Claim Integrity Task Force). Source — checked October 6, 2026.
HFMA. "MAP Keys," AR-5 and AR-6. Source — checked October 6, 2026.
Optum. "The Optum 2024 Revenue Cycle Denials Index," pages 3–6, 10–11 and 15. Source — checked October 6, 2026.
Kodiak Solutions. February 26, 2025 benchmarking report, KPI table and initial/final trend chart. Source — checked October 6, 2026.
Kodiak Solutions. May 21, 2025 release and attached KPI table. Source — checked October 6, 2026.
Kodiak Solutions. "State of the healthcare revenue cycle." March 30, 2026, Charts 3 and 7. Source — checked October 6, 2026.
Kodiak Solutions. September 15, 2026 release. Source — checked October 6, 2026.
Kodiak Solutions. March 31, 2026 release and attached "State of the healthcare revenue cycle" graphic. Source — checked October 6, 2026.
Premier Inc. "Claims Adjudication Costs Providers $25.7 Billion." February 24, 2025; 2023 claims. Source — checked October 6, 2026.
Experian Health. "2025 State of Claims," chart on physical page 3, methods on physical page 13. Source — checked October 6, 2026.
Weinreb GG, Landon BE. "Variation in medical claim denials: safety-net providers are hardest hit." Health Affairs Scholar. August 7, 2026. Figures 1 and 2; 2019 claims; CC BY 4.0. Source — checked October 6, 2026.
Vabson B, Hicks AL, Chernew ME. "Medicare Advantage denies 17 percent of initial claims; most denials are reversed, but provider payouts dip 7 percent." Health Affairs. June 2025; full Study Results. Source — checked October 6, 2026.
CMS. Transparency in Coverage Public Use File, PY2026; 2024 claims; official workbook. Source — checked October 6, 2026.
KFF. "Claims Denials and Appeals in ACA Marketplace Plans in 2024." March 24, 2026. Used to cross-check counts, not as the primary source of our dataset. Source — checked October 6, 2026.
CMS. PY2026 Transparency in Coverage data dictionary. Source — checked October 6, 2026.
CMS. PY2026 QHP Issuer Application Instructions, Transparency in Coverage; printed pages 2M-4 through 2M-7. CMS-authored copy hosted by SummaCare. Source — checked October 6, 2026.
CMS. PY2026 Transparency in Coverage data disclaimer. Source — checked October 6, 2026.
NAIC. MCAS Health National Ratio Scorecard, data year 2024, Ratio 1. Source — checked October 6, 2026.
NAIC. MCAS Health National Ratio Scorecard, data year 2025, Ratio 1. Source — checked October 6, 2026.
NAIC. MCAS Data Dashboard, aggregation method, New York coverage note and reuse terms. Source — checked October 6, 2026.
Connecticut Insurance Department. Consumer Report Card, October 2025; 2024 claims, pages 57 and 59. Source — checked October 6, 2026.
Vermont DFR. Act 152 issuer reports, Table 2.1 Grand Totals, 2024 and 2025. The regulator CSV gives all six exact filing URLs. Source — checked October 6, 2026.
Covered California. Denied-claim definitions and 2023 individual-market issuer returns. The regulator CSV gives all eleven exact return URLs and inclusion rules. Source — checked October 6, 2026.
CMS. 2027 Final Letter to Issuers, May 28, 2026; Chapter 3, Section 2, printed page 28. Source — checked October 6, 2026.
Premier Inc. "Trend Alert: Private Payers Retain Profits by Refusing or Delaying Legitimate Medical Claims." March 21, 2024; 2022 claims and original payer chart. Source — checked October 6, 2026.
MGMA. "Detecting and fixing leaks across the revenue cycle." January 7, 2026; January 6 poll. Source — checked October 6, 2026.
CMS. Medicare Claims Processing Manual, Chapter 1, sections 80.3.1–80.3.2, unprocessable claims and returned claims. Source — checked October 6, 2026.
MedicalBillingSelect Research is the research and reference section of medicalbillingselect.com.