Revenue Cycle Management Benchmarks: 14 Medical Billing KPIs and Where the Numbers Come From
By MedicalBillingSelect · Updated October 6, 2026
The 98% clean claim target follows one checked citation path from a sponsored HFMA.org guide to a 2020 Becker's ASC article written by a billing vendor. Neither page identifies a dataset behind that target. For other revenue cycle management benchmarks, AAFP's guidance gives 30 to 40 days in accounts receivable (A/R), at least 95% net collections, and under 5% in dollar-based denials. Measured results look different. See the source trail and the 14-KPI table.
Key revenue cycle benchmark statistics
- 98%, traced (our finding). One citation path for the 98% clean claim target runs from a sponsored HFMA.org guide, published in April 2023, to a February 2020 Becker's ASC article by a billing vendor's vice president. Neither page identifies a supporting dataset. (MedicalBillingSelect source check, October 2026) See the trail
- 0 of 29 (our finding). None of HFMA's 29 standard revenue cycle metric definitions, called MAP Keys, states a numerical performance target. Each one gives a formula. (MedicalBillingSelect review of HFMA's MAP Keys, October 2026)
- 14 KPIs, with their sources. This page separates published goals, measured results and formulas, and shows when their definitions differ. (MedicalBillingSelect, October 2026) See Table 1
- 18.5 days. Median net days in A/R among 5 physician-practice award and certificate recipients in HFMA's 2026 statistics. The 16 hospital and health-system award winners had a median of 43.6 days. The operating period is not stated. (HFMA, 2026)
- 5% of claims, 20% of dollars (illustration). In the same made-up set of 100 claims, 5 fully denied claims account for $4,000 of $20,000 billed. Both rates are correct; they count different things. (MedicalBillingSelect example, October 2026) See Table 6
- 7% to 8%. First-submission denial range for medical practices across the past four years, as reported in MGMA's July 2026 public benchmarking summary. It does not give a sample size for this figure. (MGMA, July 2026)
- 11.6%. Kodiak Solutions' reported average initial denial rate for 2025, up from 11.4% in 2024. Its March 2026 report describes a platform covering 2,300 hospitals and 350,000 physicians; it does not disclose the rate's denominator or sample size. (Kodiak Solutions)
- 19%. Share of in-network post-service claims ultimately denied by reporting HealthCare.gov insurers in 2024. Claims first denied and later resubmitted and paid are excluded from this denial count. (KFF analysis of CMS data, 2026)
- $57.23. Premier's reported average hospital cost to fight one denied claim for 2023 claims, 30.5% above its $43.84 figure for 2022 claims. The two surveys covered different hospital samples. (Premier, 2023 claims; 2022 claims)
- 41%. Share of 250 financial, billing and claims decision-makers who reported denial rates of 10% or more in Experian Health's 2025 survey, versus 30% in its 2022 survey. (Experian Health, pp. 2 and 12)
- 1.0%. Median denial-write-off ratio among 5 physician-practice award and certificate recipients in HFMA's 2026 statistics. The ratio uses write-offs net of recoveries and average monthly net patient revenue. (HFMA, 2026; formula AR-6)
- $8.03 vs. $2.65. Medical providers' average cost per manual versus electronic administrative transaction in the 2025 CAQH Index. These are averages across transaction types. (CAQH Index, 2025, p. 6)
- Day 14 earliest; 95% within 30 days. For Medicare fee-for-service clean electronic claims subject to the payment floor, day 14 after receipt is the earliest payment day. The prompt-payment standard covers at least 95% of clean claims outside periodic interim payment. (CMS manual, §§ 80.2.1–80.2.2; federal law)
- 48%. Share of 288 medical group leaders who named denials and appeals as their biggest revenue cycle leak. (MGMA Stat poll, January 6, 2026)
On this page: The benchmark table · Clean claim rate · Denial rate · Days in A/R · Net collection rate · HFMA award and certificate results · Cost of a denial · Payer deadlines · Formulas and worksheet · Questions for a billing company · How we built this · Cite this page · Download the data · FAQ · Sources
What are the revenue cycle management benchmarks for 2026?
There are two kinds to keep apart. A target is a number someone says you should hit. A measured result is a number someone actually counted. The 14 KPIs below show both where sources are available. A result is only a direct comparison when the formula and population match.
Quick terms first. Revenue cycle management (RCM) is everything a practice does to get paid, from the first appointment to the last dollar collected. A KPI (key performance indicator) is one number that tracks one part of that work. A/R (accounts receivable) is money you've billed and haven't been paid yet.
| KPI | Published target | Who set the target | Public measured result | Who was measured and what matches |
|---|---|---|---|---|
| Days in A/R (gross charges) | 30–40 days; below 50 | AAFP guidance | 35.5 days (median; 2020 data) | MGMA multispecialty groups; gross fee-for-service charges only, not a confirmed match to whole-practice AAFP days |
| Net days in A/R | No target in the MAP Key definition | HFMA gives a formula | 18.5 days (median) | 5 physician-practice award and certificate recipients, HFMA 2026; operating period not stated |
| A/R over 120 days | No verified target in the checked sources | See the aging section | 23.93% (median; 2022 data) | MGMA family medicine groups with 3 or fewer FTE physicians, n=278; source labels its bucket “120+” |
| Net (adjusted) collection rate | At least 95% | AAFP guidance | 97.3% (median; 2020 data) | MGMA multispecialty groups; adjusted fee-for-service collections, not a current national average |
| Cash collected as a share of net revenue | No target in the MAP Key definition | HFMA gives a formula | 101.9% (median) | 5 physician-practice award and certificate recipients, HFMA 2026 |
| Clean claim rate | 98% in the checked citation path | Sponsored HFMA.org guide credits a 2020 Becker's ASC article | No measurement dataset supporting that target identified in this path | The target's payer-facing wording differs from HFMA's scrubber formula |
| First-pass resolution rate | 95% | AMA guide, August 2025 | No matched public measured result found | — |
| Denial rate | Under 5% first-submission (MGMA); under 5% by dollars (AAFP); under 10% claim volume (AMA) | Three separate definitions | 7%–8% on first submission | Medical practices, MGMA's July 2026 summary of the past four years; not a match to the AAFP dollar rate or HFMA remittance rate |
| Denial write-offs as a share of net revenue | No target in the MAP Key definition | HFMA gives a formula | 1.0% (median) | 5 physician-practice award and certificate recipients, HFMA 2026 |
| Cost to fight a denied claim | No verified target | The historical $25 figure was an estimate | $57.23 | Hospitals, Premier, 2023 claims; survey average |
| Cost to collect | No target in the MAP Key definition | HFMA gives a formula | 3.68% (reported average; 2022 survey) | Hospital and health-system leaders, AKASA/HFMA Pulse survey; cost scope varies and is not a verified match to current HFMA FM-6 |
| Charge lag | No target in the MAP Key definition | HFMA gives a formula | 3.1 days (median) | 5 physician-practice award and certificate recipients, HFMA 2026 |
| Point-of-service collections | No target in the MAP Key definition | HFMA gives a formula | 46.6% (median) | 5 physician-practice award and certificate recipients, HFMA 2026; uses HFMA's defined collection window |
| Bad debt | No target in the MAP Key definition | HFMA gives a formula | 1.3% (median; 2025) | Kodiak's hospital data; denominator not disclosed, so not a verified match to HFMA AR-7 |
Read that table across, not down. A target with nothing measured next to it is a goal, not a fact about how practices perform. And a measured result only helps you if it counts the same way your own report does. The sections below take the big ones in turn.
What is a good clean claim rate, and where does 98% come from?
In our checked set, nine pages credit HFMA with a clean claim target: seven say 98% and two say 95% to 98%. Three link to a sponsored HFMA.org guide that credits Becker's ASC. The linked February 2020 article gives an approximately 98% goal for surgery centers without naming a supporting dataset. HFMA's own clean claim definition sets no target.
On HFMA's formula, a clean claim passes the scrubber's checks without manual changes. A scrubber is software that checks each claim for errors before it goes to the insurer.
We followed one citation path for the 98% target. The nine checked pages have different source links, listed just below it.
| Step | Page | Date | What it says | Data behind the number |
|---|---|---|---|---|
| 1 | Pabau, Firstsource and ROI That Works (linked in Table 2a) | Various | These three checked pages link to the HFMA.org guide for the clean claim target. | No supporting dataset identified |
| 2 | HFMA.org, "7 KPIs providers should be tracking" | Published April 6, 2023; updated September 11, 2024 | Says providers should aim for 98%, and credits Becker's ASC. The page is labeled as sponsored by Conifer Health Solutions. | The page links the Becker's article; no supporting dataset identified |
| 3 | Becker's ASC Review | February 25, 2020 | Says the industry standard is around 98%. Written about surgery centers by Angela Mattioda, then vice president of revenue cycle management services at Surgical Notes, a billing-services company. | No supporting dataset identified |
| — | HFMA MAP Keys, Clean Claim Rate (CL-1) | Page metadata updated February 6, 2026 | Gives the scrubber formula. Sets no target. | Not applicable |
| Page | Date shown | Value attributed to HFMA | Where its HFMA citation leads |
|---|---|---|---|
| Rivet Health | February 13, 2026 | 98% | No HFMA source link |
| Pabau | Updated September 22, 2026 | 98% | HFMA “7 KPIs” article |
| Medical Billers and Coders | June 4, 2026 | 98% | No HFMA source link |
| MDRevenueGroup on LinkedIn | July 10, 2026 | 98% | No HFMA source link |
| PGM Billing | May 11, 2026 | 98% | HFMA MAP Keys |
| AdvancedMD | April 28, 2026 | 98% | HFMA endpoint returned 404; separate Becker's link |
| Firstsource | September 22, 2026 | 95%–98% | HFMA “7 KPIs” article |
| ClaimMax RCM | May 20, 2026 | 95%–98% | HFMA homepage |
| ROI That Works | Updated August 2026 | 98% | HFMA “7 KPIs” article; MAP Keys linked separately |
Sources: MedicalBillingSelect nine-page attribution register; HFMA (2023); Becker's ASC Review (2020).
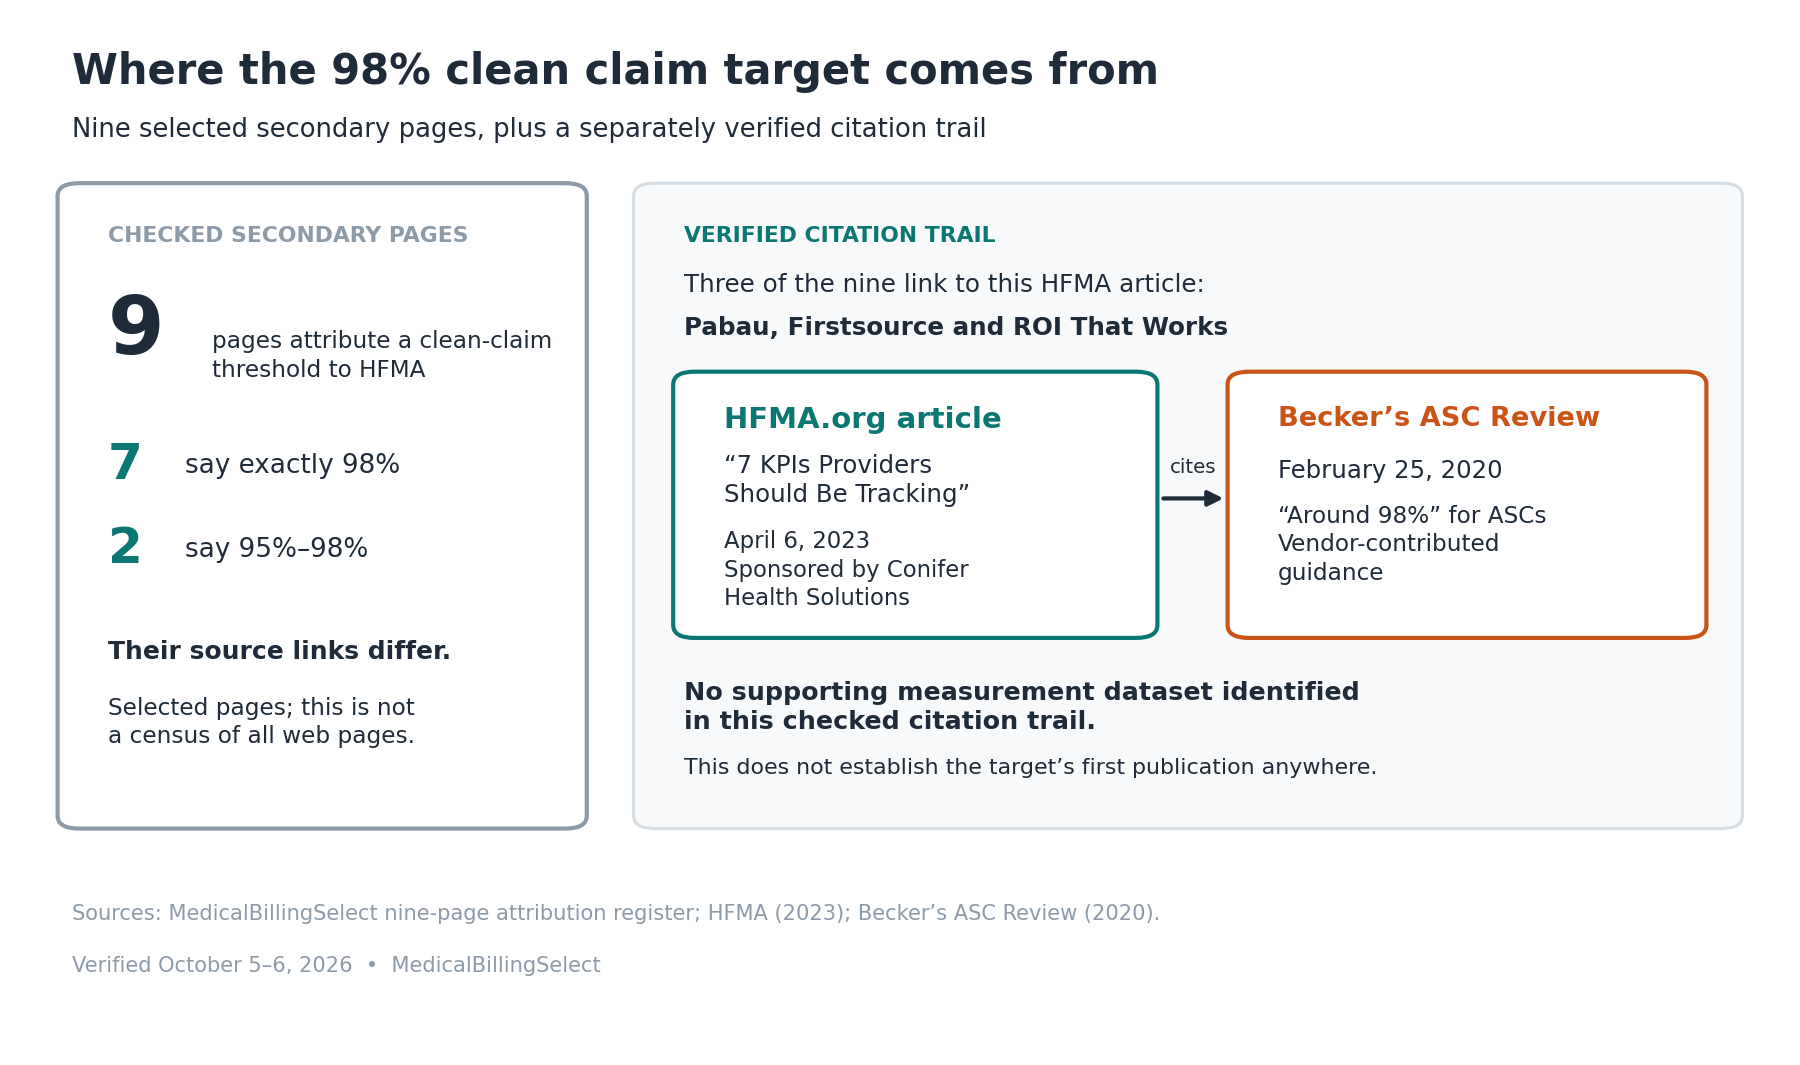
None of this means 98% is a bad goal. It may be a fine one. The checked pages do not identify data supporting it, so this citation path does not establish a measured industry average.
One more wrinkle. HFMA published real numbers for its 2026 award and certificate recipients: five measures per group, with six different measures across the sheet. Clean claim rate isn't one of them.
Why do "clean claim rate" numbers disagree?
Because different things share the name. HFMA's formula counts claims that pass your own scrubber with no hand fixes. The AMA's 95% goal counts claims the insurer approves on the first try without adjustment. An authored HFMA article uses first-pass rate for claims the insurer accepts for processing.
| Measure | What it counts | Where the count stops | Published number |
|---|---|---|---|
| Clean claim rate (HFMA CL-1) | Claims that pass scrubber edits with no manual work ÷ claims that enter the scrubber | Before the claim is sent | No target |
| First-pass resolution rate (AMA) | Claims approved on first submission without payer adjustment | When the insurer approves | 95% goal |
| First-pass acceptance rate (authored HFMA article) | Claims accepted by the payer for processing on the first attempt ÷ claims submitted | When the insurer accepts the claim for processing | No numeric target in that article |
Say 1,000 claims enter your scrubber this month. It passes 970 untouched. That's a 97% clean claim rate on HFMA's formula. After all first responses arrive for that same set, insurers approve 900 without adjustment. That's a 90% first-pass resolution rate. Same claims, both numbers true. This is an illustration, not measured practice data.
So when a billing company quotes a clean claim rate, ask which of the three it is.
What is the average claim denial rate?
It depends on who is counting. MGMA reports 7% to 8% first-submission denials for medical practices. Kodiak reports an average initial rate of 11.6% for 2025 without giving the denominator. KFF reports 19% of in-network claims ultimately denied by reporting HealthCare.gov insurers in 2024. These are different measures, not one national average.
A denial is when the insurer gets your claim and says no, in whole or in part.
| Source | Who was measured | Period | Denial rate | What the rate counts |
|---|---|---|---|---|
| MGMA | Medical practices in MGMA benchmarking | Past four years, as of July 2026 | 7%–8% | First-submission denials; public summary omits per-metric sample size and full method |
| Kodiak Solutions | Report describes a platform with 2,300 hospitals and 350,000 physicians | 2025 | 11.6% | Average initial denial rate; denominator and per-metric sample size not disclosed |
| Premier | Survey representing 280 hospitals in 23 states | 2023 claims | Nearly 15% | Initially denied claims; survey averages weighted by acute-bed capacity |
| KFF | Reporting HealthCare.gov insurers, in-network post-service claims | 2024 | 19% | Ultimately denied claims; excludes initially denied claims later resubmitted and paid |
MGMA Stat, “Days in A/R holds steady…” (July 2026 summary); Kodiak Solutions, Benchmarking Intelligence (March 2026 report); Premier, “Claims adjudication costs providers $25.7 billion” (2025); KFF, “Claims denials and appeals in ACA Marketplace plans in 2024” (2026).
The measures, populations and periods differ; these rates do not form one performance benchmark.
Sources named in each card • Verified October 5–6, 2026 • MedicalBillingSelect
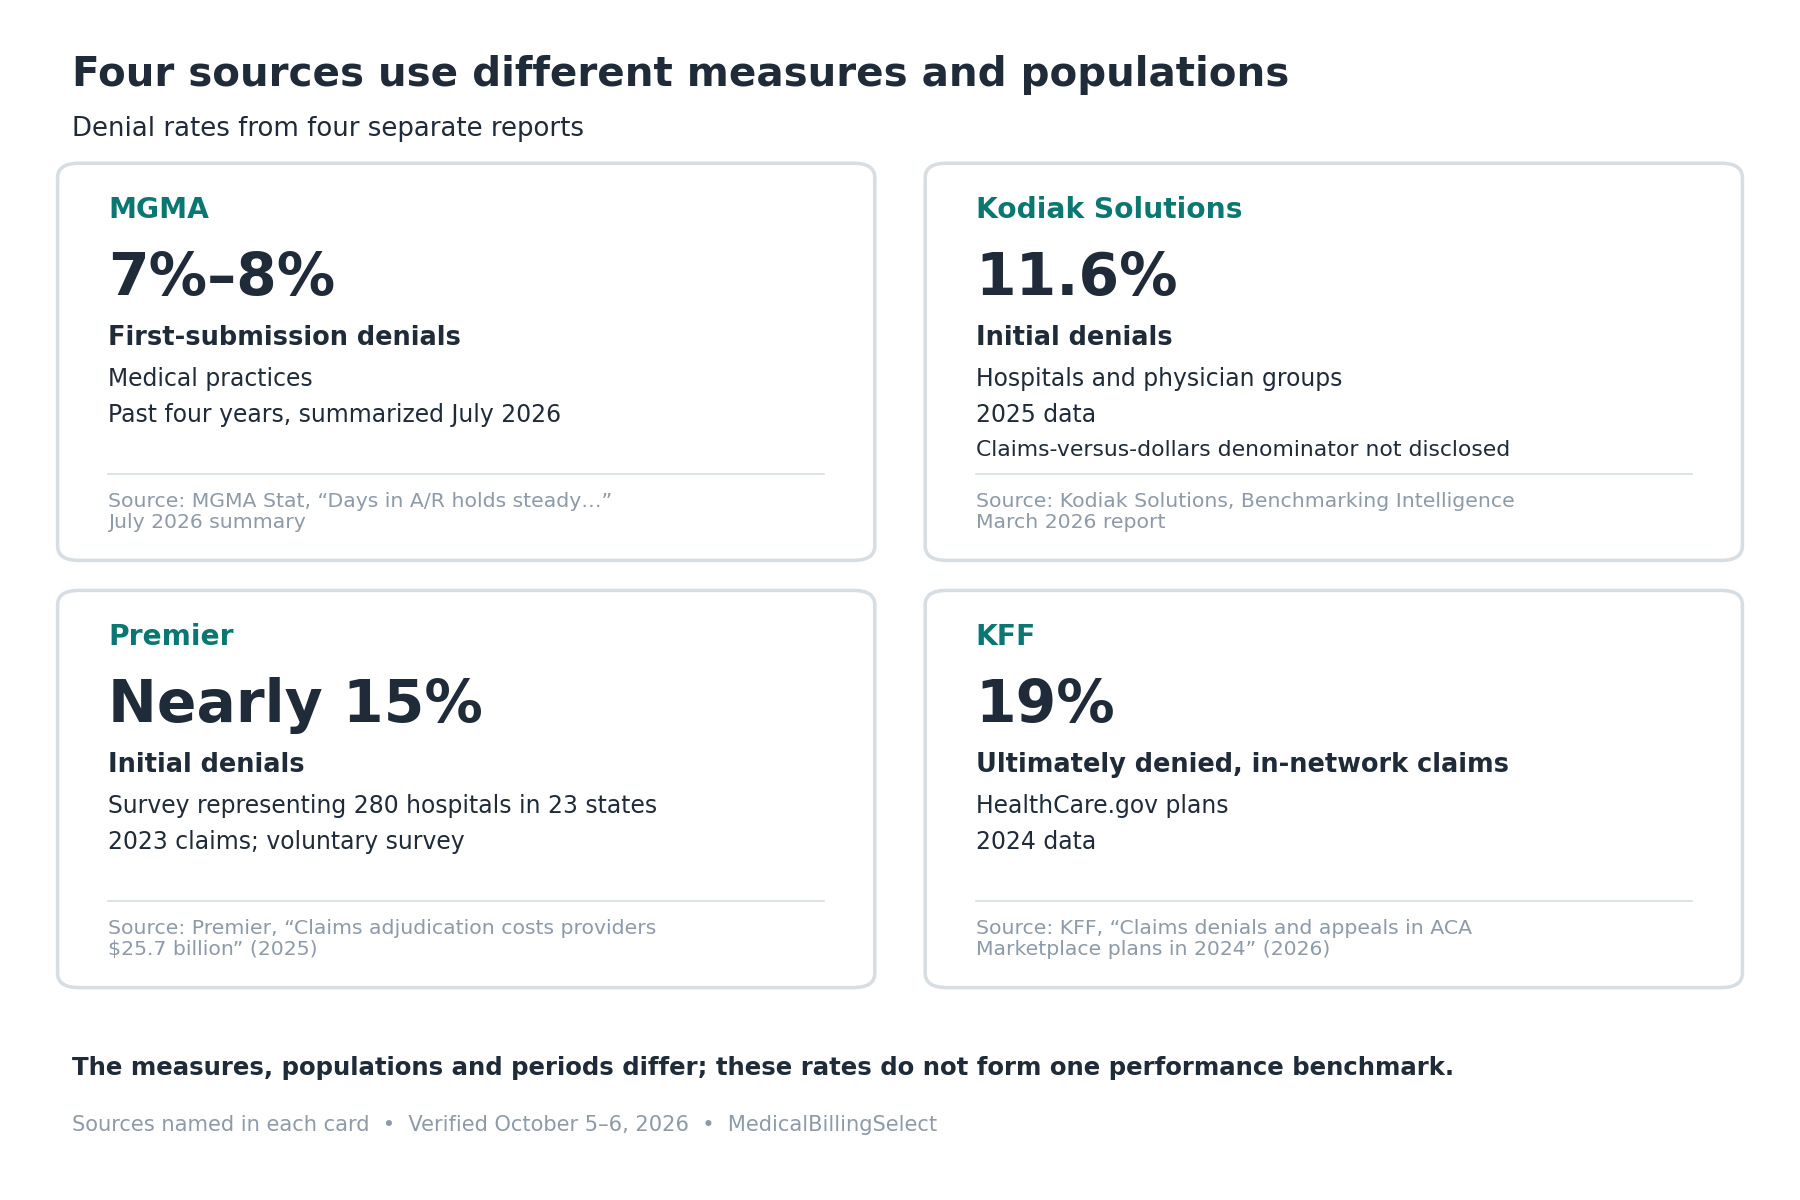
Here's the plain reading. MGMA's reported first-submission range is 7% to 8%, and its article says practices can get under 5% with focused fixes. The goal and the reported range are different things. Check your formula before using either one.
A note on Kodiak. Its May 2025 release put the 2024 rate at 11.81%. Its March 2026 report shows 11.4% for the same year. The releases describe platform coverage of more than 2,100 and 2,300 hospitals, respectively. They do not establish why the two rates differ. We show both rather than pick one. The March report lists 350,000 physicians; its next-day release says 375,000. Neither gives a sample size for the initial-denial figure.
Does the payer change the denial rate?
Premier's figures for 2023 claims span about four to one. Traditional Medicare's initial denial rate was 7.3%, and Medicaid's was 28.5%. That is about 3.9 times the rate (28.5 ÷ 7.3). The survey does not isolate payer choice as the cause of that gap.
| Payer | Initial denial rate |
|---|---|
| Traditional Medicare | 7.3% |
| Commercial | 13.2% |
| Medicare Advantage | 15.0% |
| Managed Medicaid | 16.2% |
| Medicaid | 28.5% |
Does the state change it?
The reported Marketplace rates differ by about the same four to one. HealthCare.gov insurers in South Dakota ultimately denied 7% of in-network claims in 2024. In Hawaii they denied 27%, about 3.9 times the rate (27 ÷ 7, using rounded figures). Those figures cover reporting HealthCare.gov plans only, per KFF; they do not show that the state itself caused the gap.
Are denials going up?
Experian's survey results rose through 2025. The share reporting denial rates of 10% or more went from 30% in 2022 to 38% in 2024 to 41% in 2025. That is 11 percentage points in three years. The 2025 report, pp. 2 and 12, covers 250 financial, billing and claims decision-makers surveyed June 23–July 3, 2025. These are separate survey waves, not the same people followed over time.
Kodiak's reported initial rate moved from 11.4% to 11.6% between 2024 and 2025. Its September 15, 2026 update then reported lower initial and final denial rates in the first half of 2026 than a year earlier, while increased payment takebacks reduced the benefit. So the newer direction is not simply up.
For hospitals, the original Change Healthcare 2020 Revenue Cycle Denials Index reports 9.0% for 2016 and 11.1% for July–September 2020. Its main method covers about 102 million remits from more than 1,500 hospitals during July 2019–June 2020; it does not give a separate sample count for the later quarter.
Why can the same claims have two denial rates?
Because you can count claims or you can count dollars. HFMA's remittance denial formula counts claims, including initial and appeal denials. AAFP's counts dollars denied during the period against dollars submitted. Here is a made-up set of claims, each with one final response in the same month, that shows the gap.
| Group | Claims | Billed dollars |
|---|---|---|
| Fully denied | 5 | $4,000 |
| Paid | 95 | $16,000 |
| Total | 100 | $20,000 |
| Denial rate | 5 ÷ 100 = 5% | $4,000 ÷ $20,000 = 20% |
Five small denials would barely move the dollar rate. Five big ones did. Both rates are right. They just answer different questions, so check which one is on your report before you compare it to anything.
Do denied claims get paid in the end?
Often. In Premier's surveys, 54.3% of private-payer denials on 2022 claims were later overturned and paid, and 68.6% of denials on 2023 claims were ultimately paid. Premier rounds the latter to about 70%. The first survey represented 516 hospitals in 36 states; the second represented 280 in 23 states. They use different samples and payer scopes, so the two figures are not a matched trend.
On Kodiak's platform, the median final denial rate was 2.7% in 2025, up from 2.5% in 2024. Its denominator is not disclosed in the report. A final denial reflects an amount that ends up unrecovered; it does not mean every possible appeal was made.
That gap between the first no and the final no is real work. Somebody has to chase each one.
What is a good number for days in A/R?
AAFP's guidance says 30 to 40 days, and below 50. That target uses a charge-based formula. On HFMA's net-revenue formula, 5 physician-practice award and certificate recipients in its 2026 statistics had a median of 18.5 days, and 16 hospital and health-system award winners had a median of 43.6. HFMA does not state their operating period.
Days in A/R shows how many days of charges or net revenue your unpaid balance represents. It is a ratio, not the average wait measured for each claim. There are two common ways to work it out, and they give different answers for the same practice.
| Version | Top number | Bottom number | Who publishes it |
|---|---|---|---|
| Charge-based days | Receivables excluding credit-balance accounts | (Posted charges − period credit postings) ÷ actual days in the selected period | AAFP |
| Net days | Net A/R (what you actually expect to collect) | Net patient service revenue for the last 3 months ÷ days in those months | HFMA MAP Key FM-1 |
Gross charges are your list prices. Net patient service revenue reflects deductions such as insurer discounts, charity care and allowances for amounts that will not be collected. The two formulas use different balances, revenue bases and time windows. Use the target that goes with your formula. If your report already removes credits or allowances, do not subtract them again.
A public MGMA table using 2020 data reports a median of 35.5 days of gross fee-for-service charges in A/R for multispecialty groups with primary and specialty care. The table does not give a sample count. Its surrounding text discusses adjusted fee-for-service days, but the table labels this row gross; we keep that label. It is historical context, not a confirmed match to AAFP's whole-practice formula.
| Group | Organizations | HFMA performance percentile 75 | Median | HFMA performance percentile 25 |
|---|---|---|---|---|
| Physician practices, awards and certificates combined | 5 | 16.6 | 18.5 | 21.7 |
| Critical access hospitals, awards and certificates combined | 3 | 29.7 | 34.3 | 43.7 |
| Hospitals and systems, award winners | 16 | 33.8 | 43.6 | 50.3 |
| Hospitals and systems, certificate recipients | 10 | 39.5 | 47.4 | 52.4 |
Source: HFMA 2026 MAP Award Statistical Data. Award year 2026; operating period not stated.
Selected recognition cohorts, not a national sample. IDS = integrated delivery systems.
Verified October 5–6, 2026 • MedicalBillingSelect
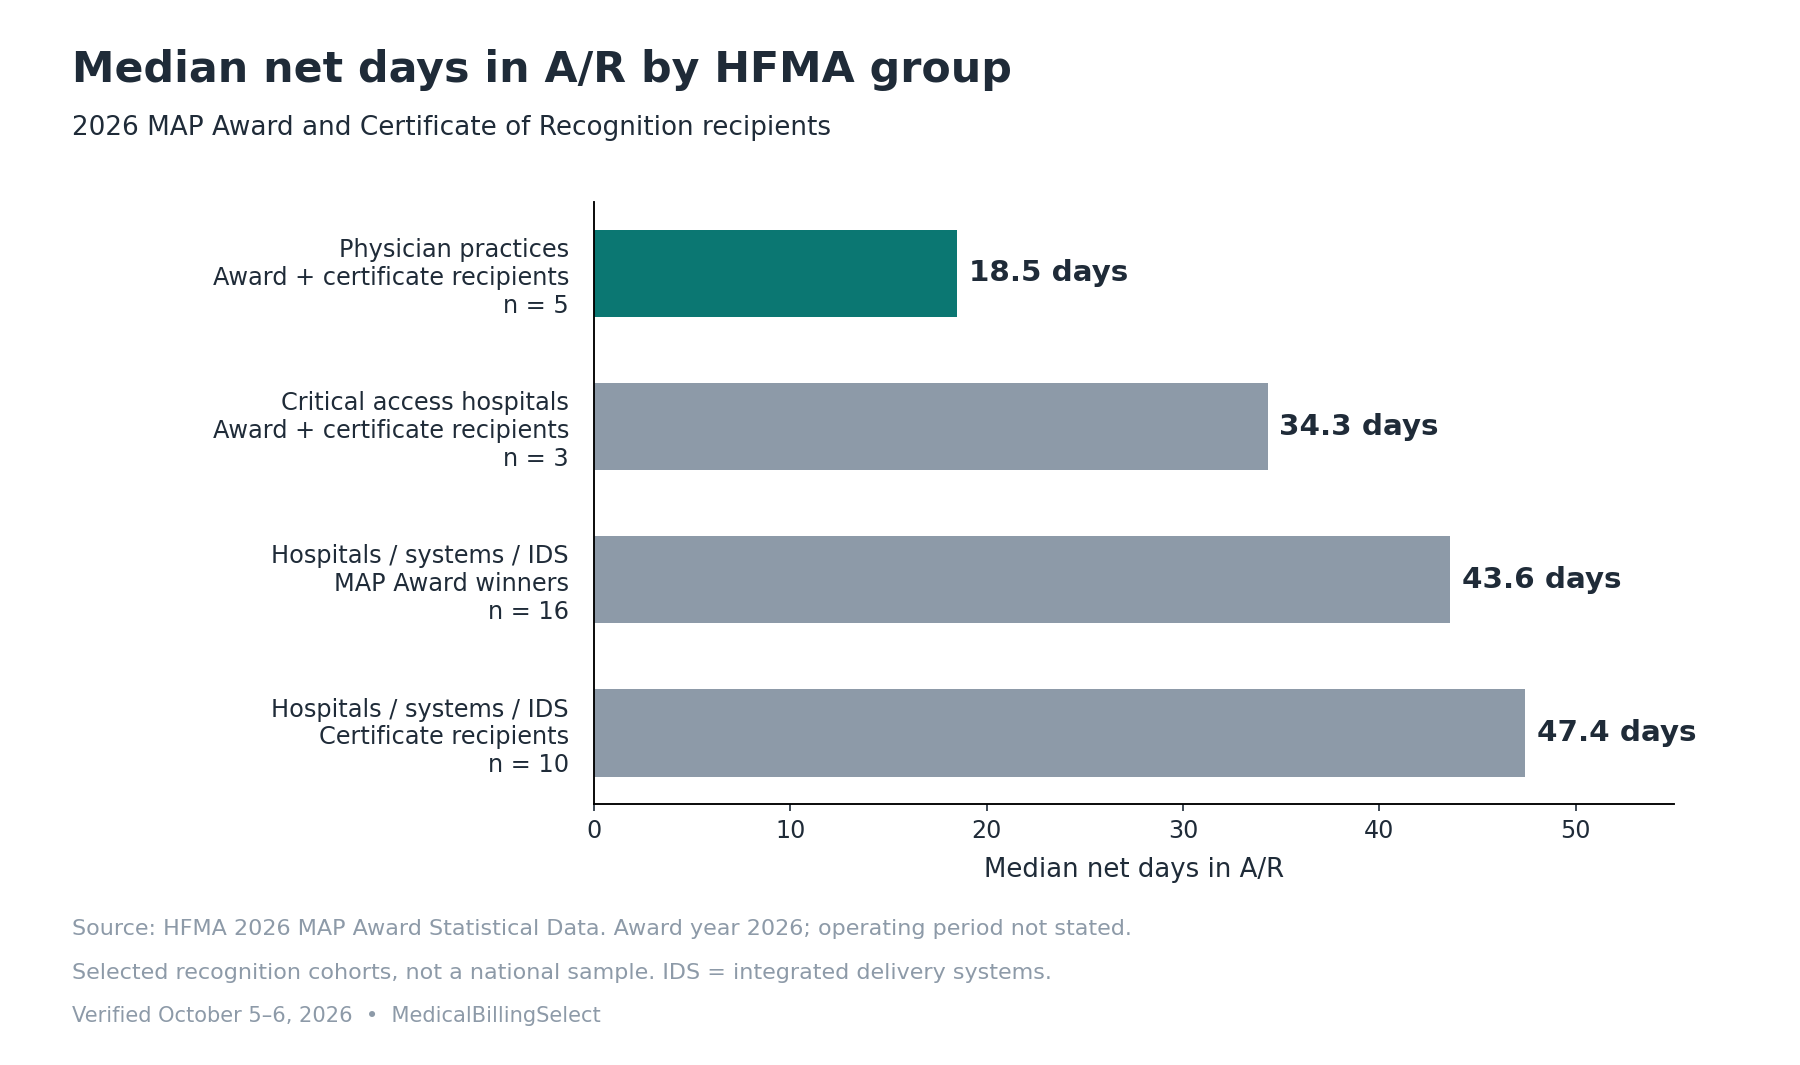
Two things to take from that. First, the median for HFMA's 16 hospital and health-system award winners is about 2.4 times the median for its 5 practice award and certificate recipients (43.6 ÷ 18.5). That compares these selected groups, not hospitals and practices as a whole. Never judge one by the other's number.
Second, 18.5 days comes from five practices that won recognition. It is a measured reference on the net formula, not a target for every practice or the average practice.
A worked example. Say your net A/R is $180,000. Your net revenue for July through September was $920,000. Those three months have 92 days. Average daily net patient revenue is $10,000 ($920,000 ÷ 92), and your net days in A/R are 18.0 ($180,000 ÷ $10,000). Revenue here is not the same as cash received that day.
What one day represents. For every $1 million in charges over a 365-day year, one charge-based day in A/R represents about $2,740 in gross receivables ($1,000,000 ÷ 365). Ten extra days represents about $27,400. This illustration assumes no charge credits; it is not a promise that all billed dollars can be collected.
What about A/R over 120 days?
A newer public example is 23.93%, the median share of A/R in the 120+ day bucket for family medicine practices with 3 or fewer full-time-equivalent physicians. That row shows a sample count of 278 in 2022 data from MGMA's 2023 DataDive, reproduced with permission in an AMA presentation, p. 26.
MGMA also published a 13.54% median for multispecialty practices, from its 2021 DataDive edition using 2020 data. These different groups do not show a change over time.
Use the age bucket and clock start shown on your report. HFMA AR-1 ages physician claims from service and inpatient accounts from discharge, using active billed accounts with debit balances. Overall days in A/R can hide a large old-balance problem; check the age buckets too.
Are days in A/R getting worse?
For about a third of poll respondents, yes. In MGMA's July 28, 2026 poll of 203 medical group leaders, 43% said their days in A/R were about the same as a year earlier, 32% said higher, 22% said lower, and 3% weren't sure. That poll counts how many leaders saw a change. It doesn't say how big the change was.
What is a good net collection rate?
AAFP's guidance sets the floor at 95% and says the average runs from 95% to 99%. It gives no survey date or sample for that average. A public MGMA table reports a 97.3% median adjusted fee-for-service collection rate for multispecialty groups with primary and specialty care, using 2020 data. That is a measured result for that group and year, not a current national average.
Net collection rate asks one question: of the money you were allowed to collect, how much did you get?
The AAFP formula is payments net of payment credits, including refunds, divided by charges minus approved contractual adjustments, over 12 months. A contractual adjustment is the discount you agreed to in your insurer contract.
A worked example: $500,000 in payments, $14,000 in refunds as the only payment credits, $850,000 in charges, $350,000 in contractual adjustments. That is $486,000 ÷ $500,000, or 97.2%. These are illustrative numbers.
Watch the bottom number. If a missed filing deadline gets written off as a "contractual adjustment," the bottom number shrinks and the rate climbs. No extra cash came in. The rate just looks better. AAFP flags this same mistake.
HFMA's measure is different on purpose. It compares one month's patient-service cash, net of refunds, with average monthly net revenue for the last three months, so it can pass 100% when old bills finally pay. Its 2026 statistics report a 101.9% median for five practice award and certificate recipients. A 101.9% there and a 97% on AAFP's formula are not on the same scale.
What do HFMA's 2026 award and certificate recipients report?
HFMA's 2026 statistics report results for selected award and certificate recipients. Among 5 recognized practices, the medians were 18.5 net days in A/R, 3.1 days of charge lag, and 1.0% in denial write-offs. The operating period is not stated.
Charge lag is the average time from service to initial charge posting, counted by charge code. HFMA's point-of-service measure includes current-visit payments through seven days after discharge, plus old-visit payments taken before or at a new visit. Routine payment-plan installments and refunds stay out of the point-of-service numerator. Total self-pay cash includes routine installments, bad-debt recoveries and loan payments. A denial write-off is money you gave up on after a denial; the ratio deducts recoveries. HFMA definitions PB-4, PA-7 and AR-6 set the full rules.
| Metric | HFMA performance percentile 75 | Median | HFMA performance percentile 25 |
|---|---|---|---|
| Net days in A/R | 16.6 | 18.5 | 21.7 |
| Charge lag, days | 2.0 | 3.1 | 4.2 |
| Point-of-service collections | 89.0% | 46.6% | 43.1% |
| Cash collected as a share of net revenue | 107.0% | 101.9% | 97.0% |
| Denial write-offs as a share of net revenue | 0.62% | 1.0% | 1.2% |
| Group | Organizations | Net days in A/R | Point-of-service collections | Cash as a share of net revenue | Denial write-offs |
|---|---|---|---|---|---|
| Hospitals and systems, award winners | 16 | 43.6 | 40.5% | 99.8% | 2.5% |
| Hospitals and systems, certificate recipients | 10 | 47.4 | 29.4% | 99.6% | 2.4% |
| Critical access hospitals, awards and certificates combined | 3 | 34.3 | 10.8% | 93.8% | 1.0% |
The write-off line is worth a second look. The median denial-write-off ratio was 2.5% for the 16 hospital and health-system award winners and 1.0% for the 5 practice award and certificate recipients. Those are medians of reported ratios, not each group's total lost revenue.
On front-desk collections, MGMA adds a useful split from its own data: in 2024, practices collected 72% of copayments at the time of service, but only about 27% of other patient balances.
What does a denied claim cost to fix?
$57.23 per denied claim is Premier's reported average for hospitals handling 2023 claims. Its 2023-claims survey is a newer measured source than the historical $25 estimate cited in AAFP's journal in 2015.
The 2015 AAFP article reports an approximately $25 rework estimate and cites a 2014 MGMA Connex article by T. Graham. We could not verify the original study's sample, measurement period or method. The $25 belongs in a citation history, not a current benchmark or target.
Premier's reported average was $57.23 for 2023 claims, 30.5% above the $43.84 reported for 2022 claims: ($57.23 ÷ $43.84 − 1) × 100. The two voluntary, bed-weighted surveys represented different samples: 280 hospitals in 23 states for 2023 claims, and 516 in 36 states for 2022 claims. This is a difference between published averages, not a measured rise at the same hospitals.
We did not verify a current measured rework cost for small practices in the sources checked. If you want yours, the worksheet below has the math: what you spend working denials, divided by the denials you worked.
What does the paperwork itself cost?
Medical providers' average cost per administrative transaction was $8.03 for manual work and $2.65 for electronic work in the 2025 CAQH Index, p. 6. The manual average is about 3.0 times the electronic average ($8.03 ÷ $2.65), a $5.38 difference. These are averages across transaction types, not a fixed price or guaranteed saving for every billing task.
The same report shows where hand work still lives. In its medical-plan transaction data, claim submission is 98% fully electronic. Claim-status inquiry is 81%. Prior authorization, where you ask the insurer's permission before a service, is only 40% fully electronic. These are transaction adoption rates, not the share of plans using a tool.
What about cost to collect?
Cost to collect is what you spend on billing for each dollar you bring in. HFMA's formula divides total revenue cycle cost by patient-service cash collected from insurers and patients, net of refunds. Its definition is marked updated August 2025. The current cost guide covers staff, vendors, software and automation; it asks users to disclose specified costs they cannot separate. The MAP Key sets no target.
A historical public observation is 3.68%, the overall self-reported average in an AKASA-commissioned HFMA Pulse survey of 556 hospital and health-system finance and revenue cycle leaders. It ran July 8–August 2, 2022. The release says cost scope varies and does not give a full denominator formula, so this is not a verified match to current HFMA FM-6 or a small-practice target.
A billing company's percentage fee is one piece of this number, not all of it. Your own staff time and software still count. Our billing cost example shows how a monthly minimum changes that one piece.
How fast do payers have to pay a clean claim?
For Medicare fee-for-service, the federal standard is at least 95% of clean claims paid within 30 calendar days after receipt, outside periodic interim payment. For electronic claims subject to the payment floor, day 14 is the earliest payment day. State Medicaid agencies have 30- and 90-day standards for clean practitioner claims. These clocks run from claim receipt; they are not a target for your A/R ratio.
| Program | Rule | Source |
|---|---|---|
| Medicare (fee-for-service) | Pay at least 95% of clean claims outside periodic interim payment within 30 calendar days after receipt | Social Security Act §1816(c); §1842(c) |
| Medicare, compliant electronic claims | For claims subject to the payment floor, a 13-day wait after receipt; earliest payment is day 14 | CMS Claims Processing Manual, ch. 1, §80.2.1.2 |
| Medicare, paper claims | For claims subject to the payment floor, a 28-day wait after receipt; earliest payment is day 29 | CMS Claims Processing Manual, ch. 1, §80.2.1.2 |
| Medicare Advantage | Pay 95% of clean claims within 30 days after receipt for noncontracted services and private fee-for-service plan claims | 42 CFR 422.520(a) |
| Medicaid (state agencies) | Pay 90% of clean claims from practitioners within 30 days after receipt and 99% within 90 days; applies to individual, group and shared-facility practice | 42 CFR 447.45(d) |
| Medicaid, filing limit | States must require provider filing no later than 12 months from service; this is a federal outer limit, not a guaranteed filing period for every claim | 42 CFR 447.45(d)(1) |
Here's why this belongs on a benchmark page. For Medicare claims subject to the floor, a compliant electronic claim cannot be paid before day 14 after receipt, and a paper claim before day 29. Those earliest dates do not mean every claim will be paid by day 30.
How do you calculate each KPI and check your own numbers?
Each KPI is one number divided by another. HFMA publishes 29 standard formulas, and AAFP's live page explains three practice metrics. The 14 below cover the subjects on this page, and the free worksheet lets you fill in your own totals.
| KPI | Formula | Formula source |
|---|---|---|
| Days in A/R (charge-based) | A/R excluding credit-balance accounts ÷ [(posted charges − period credit postings) ÷ actual days in the period] | AAFP |
| Net days in A/R | Net A/R ÷ (net patient service revenue for the last 3 full months ÷ actual days in those months) | HFMA FM-1 |
| A/R over 120 days | Active billed debit-balance A/R aged 121+ days ÷ all active billed debit-balance A/R | HFMA AR-1 |
| Net (adjusted) collection rate | (Payments − payment credits, including refunds) ÷ (charges − approved contractual adjustments), over 12 months | AAFP |
| Cash collected as a share of net revenue | Month's patient-service cash, net of refunds ÷ average monthly net patient service revenue (last 3 months) | HFMA FM-2 |
| Clean claim rate | Claims passing scrubber edits with no manual work ÷ claims entering the scrubber | HFMA CL-1 |
| First-pass resolution rate | Claims approved on first submission without payer adjustment ÷ claims submitted in the defined group | AMA |
| Denial rate | Actionable denied claims, including initial and appeal denials ÷ remitted claims in the month (HFMA); or dollars denied ÷ dollars submitted in the period (AAFP) | HFMA AR-5; AAFP |
| Denial write-offs | Month's denial write-offs net of recoveries ÷ average monthly net patient service revenue (last 3 months) | HFMA AR-6 |
| Cost to fight a denied claim | Staff and vendor cost of working denials ÷ denials worked, using a defined period and cost scope | Local calculation; no verified standard formula |
| Cost to collect | Total revenue cycle cost ÷ patient-service cash from insurers and patients, net of refunds, for the same month | HFMA FM-6 |
| Charge lag | Total days from service to initial revenue posting across charge codes ÷ number of charge codes billed | HFMA PB-4 |
| Point-of-service collections | (Current-visit cash through 7 days after discharge + prior-visit cash before/at a new visit) ÷ month's self-pay cash; apply HFMA exclusions | HFMA PA-7 |
| Bad debt | Month's income-statement bad-debt provision ÷ same-month gross patient service revenue | HFMA AR-7 |
The worksheet. Download medical-billing-kpi-worksheet.csv and open it in any spreadsheet program. It has 15 blank KPI rows covering the 14 subjects, plus one filled example. Each row gives the formula, space for your top and bottom numbers, and a sourced goal or measured reference where one is available. Denial rate gets two rows, one for remitted claims and one for dollars. References with different definitions are labeled as context, not direct comparisons. You only need report totals. No patient names or records go in it.
To test your setup, try these illustrative numbers first. Use $65,000 in receivables with credit balances already excluded. If posted charges after period credits are $600,000 over 365 days, the result is 39.54 days. Ask your report provider which balance excludes credits; do not guess the sign of a ledger adjustment.
Calculator
Revenue-cycle KPI calculator
Enter totals from your own reports. Every calculation stays in this browser: nothing is sent, saved, or logged, and nothing is stored after you leave the page. Enter aggregate totals only; never patient or personal data. Leave any field empty and the measures that do not need it still calculate.
Results by measure
Results are arithmetic on your entries, not an assessment. Percentages can exceed 100%. Net write-offs keep their sign.
Days in A/R
- Source:
- AAFP; HFMA MAP Key FM-1
- Population:
- Your practice; definitions differ by formula.
Charge-based days in A/R
Waiting for inputs
Missing: Receivables with credit-balance accounts already excluded; Posted charges before period credits; Charge credits to remove; Charge-period start and end dates, or a day count
Gross receivables represented per day
Waiting for inputs
Missing: Posted charges before period credits; Charge credits to remove; Charge-period start and end dates, or a day count
Net days in A/R
Waiting for inputs
Missing: Net A/R; Net patient-service revenue, trailing 3 months; Closed reporting month or trailing-three-month days
Comparison and mismatch: AAFP guidance: 30–40 days preferred and below 50, using the charge-based formula. HFMA FM-1 has no target; HFMA's 2026 median was 18.5 days for 5 practice award/certificate recipients, with operating period unstated. These are not the same measure.
A/R over 120 days
- Source:
- HFMA MAP Key AR-1; MGMA; AMA presentation
- Population:
- Your active billed debit-balance A/R; published comparisons cover different groups and age-bucket labels.
A/R over 120 days
Waiting for inputs
Missing: Same A/R aged over 120 days; Active billed debit-balance A/R; Closed reporting month
Comparison and mismatch: No verified target. MGMA reported 13.54% for 2020 multispecialty groups; AMA reproduced 23.93% for 2022 family-medicine groups with 3 or fewer FTE physicians (n=278). These are context, not matched comparisons.
Net (adjusted) collection rate
- Source:
- AAFP; MGMA
- Population:
- Your practice's selected 12-month collection period.
Net (adjusted) collection rate
Waiting for inputs
Missing: Payments, selected 12 months; Payment credits, including refunds; Gross charges; Approved contractual adjustments; 12-month collection period start and end
Comparison and mismatch: AAFP guidance: at least 95%; it describes 95%–99% as an average without giving a survey date or sample. MGMA's 97.3% median is for 2020 multispecialty adjusted FFS collections, not a current whole-practice norm.
Cash collected as a share of net revenue
- Source:
- HFMA MAP Key FM-2
- Population:
- Your reporting-month patient-service cash against the trailing-three-month revenue average.
Cash collected as a share of net revenue
Waiting for inputs
Missing: Patient-service cash, net of refunds; Net patient-service revenue, trailing 3 months; Closed reporting month
Comparison and mismatch: HFMA's 2026 median was 101.9% for 5 practice award/certificate recipients. Cash/revenue ratios can exceed 100%.
Clean claim rate
- Source:
- HFMA MAP Key CL-1
- Population:
- Your claims entering and passing the scrubber.
Clean claim rate (HFMA CL-1)
Waiting for inputs
Missing: Claims passing edits without manual work; Claims entering the scrubber; Closed reporting month
Comparison and mismatch: CL-1 sets no target. The checked 98% citation path is guidance with a different payer-facing endpoint, not a matched scrubber benchmark.
First-pass resolution rate
- Source:
- AMA guide, August 2025
- Population:
- Selected claim cohort with first responses complete.
First-pass resolution rate (AMA)
Waiting for inputs
Complete the selected cohort's first responses before calculating or comparing this measure.
Mark the selected cohort's first responses complete before showing its AMA comparison.
Denial rates
- Source:
- HFMA MAP Key AR-5; AAFP
- Population:
- Your monthly remittance claim count and the selected period's billed dollars.
Remittance denial rate (HFMA AR-5)
Waiting for inputs
Missing: Actionable denied claims; Claims with a payer remittance; Closed reporting month
Dollar-weighted denial rate (AAFP)
Waiting for inputs
Missing: Dollars denied; Billed dollars submitted; Other KPI period start and end
Comparison and mismatch: HFMA AR-5 has no target and includes actionable initial and appeal denials. AAFP guidance under 5% is dollar-weighted. Do not attach first-submission or claim-volume thresholds to AR-5.
Denial write-offs
- Source:
- HFMA MAP Key AR-6
- Population:
- Your reporting-month write-offs, net of recoveries, divided by average monthly NPSR.
Denial write-offs as a share of net revenue
Waiting for inputs
Missing: Denial write-offs; Recoveries from denial write-offs; Net patient-service revenue, trailing 3 months; Closed reporting month
Comparison and mismatch: HFMA's 2026 median was 1.0% for 5 practice award/certificate recipients.
Cost to fight a denied claim
- Source:
- Local calculation; Premier context
- Population:
- Your selected staff/vendor costs divided by denials worked in the selected period.
Cost to fight one denied claim
Waiting for inputs
Missing: Staff and vendor cost of denial work; Denials worked; Other KPI period start and end
Comparison and mismatch: No verified target or standard formula. Premier's $57.23 for hospitals' 2023 claims is context with a different cost scope and sample. The historical $25 estimate is not a target.
Cost to collect
- Source:
- HFMA MAP Key FM-6; AKASA survey
- Population:
- Your reporting-month revenue-cycle cost divided by patient-service cash net of refunds.
Cost to collect
Waiting for inputs
Missing: Total revenue-cycle cost; Patient-service cash, net of refunds; Closed reporting month
Comparison and mismatch: FM-6 has no target. The 3.68% self-reported 2022 hospital/health-system survey average is context, not a verified match to current FM-6.
Charge lag
- Source:
- HFMA MAP Key PB-4
- Population:
- Your summed service-to-initial-posting days divided by charge codes billed.
Charge lag
Waiting for inputs
Missing: Total service-to-initial-posting days; Charge codes billed; Other KPI period start and end
Comparison and mismatch: HFMA's 2026 median was 3.1 days for 5 practice award/certificate recipients. AMA chart-closure guidance is not a posting-lag target.
Point-of-service collections
- Source:
- HFMA MAP Key PA-7
- Population:
- Your eligible point-of-service cash divided by all posted monthly patient cash; match hospital/physician scope.
Point-of-service collections (HFMA PA-7)
Waiting for inputs
Missing: Cash eligible under HFMA PA-7; Total posted monthly patient cash; Closed reporting month
Comparison and mismatch: HFMA's 2026 median was 46.6% for 5 practice award/certificate recipients. Match PA-7's window and exclusions.
Bad debt
- Source:
- HFMA MAP Key AR-7; Kodiak context
- Population:
- Your same-month income-statement provision divided by gross patient-service revenue.
Bad debt
Waiting for inputs
Missing: Income-statement bad-debt provision; Gross patient-service revenue; Closed reporting month
Comparison and mismatch: AR-7 has no target. Kodiak's 1.3% median for 2025 has an undisclosed denominator, so it is not an automatic formula-matched comparison.
Why does this matter now?
Because denials and appeals led MGMA's January 2026 poll of revenue cycle leaks, and the yardsticks keep moving. Three dated facts:
- In MGMA's January 6, 2026 poll, 48% of 288 medical group leaders named denials and appeals their biggest revenue cycle leak. Front-end problems came second at 23%.
- HFMA marks its cost-to-collect definition as updated in August 2025. Check which costs each report includes before comparing it with another.
- Medicare's own payments aren't error-free. CMS estimated its fee-for-service improper payment rate at 6.55% in fiscal 2025, or $28.83 billion. CMS notes that an improper payment is not the same thing as fraud.
What should you ask a billing company about its numbers?
Ask for the formula behind every KPI it quotes. A 98% clean claim rate can mean three different things, and a denial rate can be counted in claims or dollars. Five questions settle most of it:
- What goes on top and what goes on the bottom of this number?
- Is it counted in claims or in dollars?
- What dates does it cover, and when does the clock start and stop?
- What gets left out? Think appeals, old balances, patient-owed amounts.
- Whose results is it compared with, and how many of them were there?
This is the same standard we hold provider claims to. Our methodology explains how we treat performance claims, and our homepage lists what to check for your practice by size and specialty.
If your numbers are far off and you're weighing outside billing help, our published billing company examples show the fees and contract terms to compare before you sign.
How we built this
We checked the sources on October 5–6, 2026, and wrote down four things for every number: who published it, who was measured, what period it covers, and how it was counted.
For the clean claim trail, we read nine full pages that credit HFMA with a target. Seven say 98%; two say 95%–98%. We recorded the destination of each attribution: three point to the sponsored “7 KPIs” guide, one to MAP Keys, one to HFMA's homepage, one to an HFMA address that returned 404, and three give no HFMA link. We read the guide and its linked Becker's article. We also reviewed all 29 MAP Key definitions; none states a numerical performance target. This is a selected source check, not a census or proof of the target's first appearance.
For measured results, we checked the original producer reports and charts, including all 80 values in HFMA's two-page 2026 statistics sheet, Kodiak's March 2026 report images, Premier's original reports and payer table, and the CAQH and Experian report charts. We kept each source's population, period and formula limits. We did not turn a vendor's unsupported goal into a measured result or merge rates with different denominators.
Every ratio on this page is simple division, and each one shows its two numbers so you can redo it. Percentage changes use (new ÷ old − 1) × 100; percentage-point changes use subtraction. The denial example in Table 6 and the worked examples use invented numbers and are labeled that way. The downloadable register preserves original observations separately from our counts, calculations and examples. The embedded register and downloadable CSV are identical.
The worksheet formulas were checked against the named definitions. To reproduce a comparison, filter the register by KPI, source, population, period and statistic; use the source's stated denominator before comparing the value with a goal.
What this data does and doesn't show
It shows where the checked billing numbers come from and what dated public measurements say. It does not show what your practice should score.
- Most measured data is hospital data. Kodiak, Premier and most of HFMA's award groups are hospitals and health systems. Small practices are thinly covered.
- HFMA's practice numbers come from five award and certificate recipients combined. They describe a selected group, not typical performance, and HFMA doesn't give the operating period.
- The sources count differently. Claims versus dollars, first submission versus final, gross versus net. We kept each number with its own definition and did not blend them.
- KFF's 19% is an ultimate-denial rate for reporting HealthCare.gov plans. It says nothing direct about employer plans or Medicare, and it excludes initial denials later resubmitted and paid.
- Some source methods are incomplete. Kodiak does not disclose the denominators for the cited denial and bad-debt rates. MGMA's public 7%–8% summary gives no per-metric sample size. The historical $25 estimate lacks a verified original study method.
- A target with no data behind it can still be a sensible goal. We're reporting where the numbers come from, not telling you to ignore them.
- Nothing here predicts what a billing company will collect for you.
How to cite this page
Credit the original source for its own number, and credit MedicalBillingSelect for the source check, the comparisons, and the math.
MedicalBillingSelect. "Revenue Cycle Management Benchmarks: 14 Medical Billing KPIs and Where the Numbers Come From." Updated October 6, 2026. https://medicalbillingselect.com/medical-billing-benchmarks/
Every table, section and key statistic has a stable anchor. Keep the source, population, period and definition with any number you cite.
Reuse. You may reuse MedicalBillingSelect's original table and chart designs, calculations and source-check findings with credit to MedicalBillingSelect by name. No link is required. This permission covers our contribution only. Preserve attribution and applicable terms for source material from HFMA, AAFP, AMA, MGMA, Kodiak, Premier, KFF, Experian, CAQH, CMS and other named publishers; it does not grant rights to their reports or artwork.
Download the data
Two files, free, no sign-up:
- rcm-benchmark-source-check.csv: 186 rows. Every target, measured result, federal rule and formula on this page, plus all 80 values from HFMA's 2026 award statistics. Each row has its source link, who was measured, the period, and the date we checked it.
- medical-billing-kpi-worksheet.csv: the fill-in worksheet described above.
Frequently asked questions
What is a good net collection rate?
AAFP's guidance says at least 95%, with the average between 95% and 99%. It gives no survey date or sample for that average. MGMA reports a 97.3% median adjusted fee-for-service collection rate for multispecialty groups using 2020 data. Keep the group, year and formula with that figure.
What is a good denial rate for a medical practice?
MGMA reports 7% to 8% first-submission denials for practices over the past four years and says practices can get under 5%. AAFP's under 5% goal uses denied dollars. The AMA guide, p. 12, says under 10% claim volume, with 2% to 3% exceptional; it does not label that measure initial-only. Match the definition before using a goal.
Does HFMA publish benchmark numbers?
Yes. HFMA's 2026 award statistics cover 34 organizations across four groups: 16 hospital/system/IDS award winners, 10 certificate recipients, 3 critical-access recipients and 5 practice recipients. The last two groups combine awards and certificates. The separate 29 MAP Key definitions give formulas without numerical performance targets.
Is clean claim rate the same as first-pass rate?
No. HFMA CL-1 counts claims that pass your own scrubber before they're sent. AMA's first-pass resolution counts claims approved on the first try without adjustment. Some articles instead use first-pass rate for payer acceptance for processing. Our made-up example scores 97% on scrubber checks and 90% on first-pass resolution for the same claims.
What percent of denied claims get overturned?
In Premier's hospital surveys, 54.3% of private-payer denials on 2022 claims were overturned and paid. For 2023 claims, 68.6% of denials were ultimately paid, rounded by Premier to about 70%. The samples and payer scopes differ; those are not a matched year-to-year trend.
How long does Medicare take to pay a clean claim?
For fee-for-service claims subject to the floor, the earliest payment is day 14 after receipt for a compliant electronic claim and day 29 for paper. The federal standard is payment of at least 95% of clean claims outside periodic interim payment within 30 calendar days after receipt. This is a rule, not a measured usual wait or a guarantee for each claim. CMS manual, §§ 80.2.1–80.2.2; federal law.
Should a small practice use hospital benchmarks?
Use practice figures with a matching formula when you can find them. In HFMA's 2026 statistics, 16 hospital and health-system award winners had a median of 43.6 net days in A/R; 5 practice award and certificate recipients had 18.5. Those selected groups provide context, not a hospital target for a small practice.
What's the difference between a rejected claim and a denied claim?
A rejected claim has not been accepted for claim processing; a clearinghouse or payer may reject it for a data or format problem. A denied claim has been processed, and the insurer said no to all or part of payment. HFMA's remittance denial formula counts denials, not front-end rejections.
Which medical billing KPIs should a practice start with?
AAFP's live practice page explains three: days in A/R, adjusted collection rate and denial rate. They track unpaid balances, money collected against allowed charges, and denials. Use the formulas beside them; the 14 subjects in Table 1 add more detail.
Sources
- HFMA. "HFMA MAP Keys." Page metadata updated February 6, 2026. Read the source — checked October 5, 2026.
- HFMA. "7 KPIs providers should be tracking." Sponsored by Conifer Health Solutions. Published April 6, 2023; updated September 11, 2024. Read the source — checked October 5, 2026.
- Becker's ASC Review. "Improving ASC KPIs: Clean claim percentage, denial rate, and denial reason trending." Angela Mattioda, Surgical Notes. February 25, 2020. Read the source — checked October 5, 2026.
- HFMA. "2026 MAP Award Statistical Data." Award year 2026; operating period not stated. Read the source — checked October 5–6, 2026.
- AAFP. "Managing practice finances." Undated live guidance. Read the source — checked October 5–6, 2026.
- AMA. "A physician's guide to effective revenue cycle management." Updated August 2025; KPI goals on p. 12. Read the source — checked October 5, 2026.
- MGMA. "Days in A/R holds steady for most practices, but payer pressure persists in 2026." July 30, 2026. Read the source — checked October 5, 2026.
- MGMA. "Detecting and fixing leaks across the revenue cycle." January 7, 2026; poll January 6. Read the source — checked October 5, 2026.
- MGMA. "Not-so-graceful aging: Half of practices saw days in A/R increase in 2021." November 11, 2021; 2021 DataDive edition, 2020 data. Read the source — checked October 5, 2026.
- Kodiak Solutions. "State of the healthcare revenue cycle." March 30, 2026; original chart images for 2024–2025 rates. Read the source — checked October 5, 2026.
- Kodiak Solutions. Producer release on final denials and bad debt. March 31, 2026. Read the source — checked October 5, 2026.
- Kodiak Solutions. Producer release on 2024 initial denials. May 21, 2025. Read the source — checked October 5, 2026.
- Premier. "Claims Adjudication Costs Providers $25.7 Billion." February 24, 2025; 2023 claims. Read the source — checked October 5, 2026.
- Premier. "Trend Alert: Private Payers Retain Profits by Refusing or Delaying Legitimate Medical Claims." March 21, 2024; 2022 claims. Read the source — checked October 5, 2026.
- KFF. "Claims Denials and Appeals in ACA Marketplace Plans in 2024." March 24, 2026. Read the source — checked October 5–6, 2026.
- Experian Health. "State of Claims 2025." Original report, public distributor copy; pp. 2, 4 and 12. Read the source — checked October 5, 2026.
- Experian. Producer press release on State of Claims 2025. September 22, 2025. Read the source — checked October 5, 2026.
- AAFP, FPM. "The Cure for Claims Denials." March 2015. Reference 2 cites Graham T., MGMA Connex., 2014;14(2):37–38. This verifies the historical citation, not the original study method. Read the source — checked October 5, 2026.
- CAQH. "2025 CAQH Index Report: Executive Report." 2025 Index edition; adoption on p. 3 and cost chart on p. 6. Read the source — checked October 5–6, 2026.
- Social Security Act §1816(c), 42 U.S.C. 1395h(c), Medicare Part A prompt payment. Read the source — checked October 6, 2026.
- Social Security Act §1842(c), 42 U.S.C. 1395u(c), Medicare Part B prompt payment. Read the source — checked October 6, 2026.
- CMS. Medicare Claims Processing Manual, chapter 1, §§ 80.2.1–80.2.2. Clean claims, payment floors and interest. Read the source — checked October 6, 2026.
- 42 CFR 422.520, prompt payment by Medicare Advantage organizations. Read the source — checked October 5–6, 2026.
- 42 CFR 447.45, timely Medicaid claims payment. Read the source — checked October 5–6, 2026.
- CMS. "Fiscal Year 2025 Improper Payments Fact Sheet." January 15, 2026. Read the source — checked October 5–6, 2026.
- Change Healthcare. "2020 Revenue Cycle Denials Index." Original producer report preserved with the Physicians Practice publication. Read the source — checked October 5, 2026.
- MGMA. "Data Mine: Measuring success—Finding the right metrics to optimize the revenue cycle." December 14, 2021, Table 1; 2020 data. Read the source — checked October 5, 2026.
- AMA. "I Am a Small Practice—So Many Hats!" June 7, 2024; permission statement p. 22 and MGMA family-medicine aging table p. 26; 2022 data. Read the source — checked October 5–6, 2026.
- AKASA. Producer release on a cost-to-collect survey conducted through HFMA Pulse. September 15, 2022. Read the source — checked October 6, 2026.
- HFMA. "Guide to Better Practices in Measuring Cost-to-Collect." No printed issue date; linked FM-6 definition marked updated August 2025. Read the source — checked October 5, 2026.
- Eric Matson, HFMA. "Ensuring the Revenue Cycle Gets a Clean Bill of Health." Published September 11, 2018; updated December 13, 2024. Read the source — checked October 5, 2026.
- Kodiak Solutions. Producer release on the first half of 2026. September 15, 2026. Read the source — checked October 5, 2026.
The nine checked secondary pages are individually linked in Table 2a and recorded in the downloadable source register.
MedicalBillingSelect is a comparison publisher for US practices.